Carbon management plan
Introduction
Globally, climate change has become a cause for concern, with human activities dangerously increasing greenhouse gas emissions. Ashfield District Council (ADC) recognises that we have a responsibility to act and reduce our own contribution to climate change and achieve net zero emissions. In order to meet our aims we have conducted a full greenhouse gas analysis of the Council’s own operational emissions and produced this Carbon Management Plan.
ADC has already made considerable progress in reducing its emissions through multiple different projects, including installing solar PV on many council owned buildings, operating smarter working practices in council offices and launching a Climate Change Officer Working Group to collaboratively drive reductions in carbon emissions. Also, Council decision making now includes assessments of impact on sustainability and the environment. The impacts of these projects, actions, and other influential factors (discussed throughout this report) has meant that ADC emissions have already reduced by 25% since 2015/161.
This Carbon Management Plan analyses the trends of remaining ADC emissions and sets out key actions for ADC to take to reduce them, as well as actions to improve data quality and monitoring of ADC emissions footprint. Alongside reducing the Council’s own emissions, ADC recognises the importance of supporting the decarbonisation of the whole Ashfield District, in line with UK Government targets of achieving net-zero by 2050 and the international target of keeping global temperature rise well below 2oC, and will act where it can to influence and assist the wider district to meet such targets.
Emissions Reporting Boundary
Ashfield District Council (ADC) is reporting its full greenhouse gas emissions profile, following the Greenhouse Gas (GHG) Protocol. This methodology is compliant with UK Government reduction targets, Global Covenant of Mayors and the Carbon Disclosure Programme (CDP).
ADC emissions are reported here across three different scopes2:
- Scope 1 - Direct emissions from ADC controlled or owned sources
- Scope 2 - Indirect emissions from the generation of purchased energy used by ADC
- Scope 3 - Indirect emissions associated with the value chain of the council, both upstream into the council and downstream out of the council.
The type of organisational boundary set by ADC determines which emissions are included in each scope. Ashfield District Council has chosen to use an operational control boundary, meaning emissions are reported in scope 1 and 2 where ADC has full authority to introduce and implement operational policy3. This boundary best represents emissions for which ADC has the ability to influence greenhouse gas emissions from its own assets and operations.
The majority of emissions reported in scope 1 and 2 are not impacted by the type of organisational boundary chosen. One of the most important considerations is with how leased assets are treated. Under operational control, assets that the council leases from external companies are deemed to be under ADC’s operational control and as such are included in Scope 1 and 2 emissions. Meanwhile, assets that the council owns but leases out to external parties are considered not to be under its operational control and are included as scope 3 emissions.
The calculation methodologies for each category of ADC emissions vary depending on the availability of data (see Appendix 3 and 4). Some methods use specific data (e.g. Scope 1 and 2 consumption data), whilst other categories use spend-based approaches (e.g. purchased goods and services). Actions to improve data quality and emissions monitoring for ADC to enact are outlined in Section 10.
It is important to note that ADC has chosen to report its full greenhouse gas footprint as carbon dioxide equivalences, this includes carbon dioxide (CO2) and wider greenhouse gas emissions such as methane and nitrous oxide. In doing so, the council aims to reduce emissions associated with its estate, travel, services and consumption. The GHG Protocol outlines 15 categories to report scope 3 emissions4; 9 of these being applicable to the local authority (see Appendix 4).
Following Chapter 5 of the GHG Protocol Corporate Standard, the base year 2015/16 emissions for ADC have been calculated to include emissions from Ashfield Homes5. As the emissions have transferred from Ashfield Homes to Ashfield District Council, without any change in emissions released to the atmosphere, the emissions are also transferred from one organisation’s inventory to the other.
1 Not including ADC investment emissions – see section 2
2 Greenhouse Gas Protocol FAQ [PDF]
4 Greenhouse Gas Protocol Technical guidance for calculating Scope 3 emissions [PDF]
5 Emissions for Ashfield Homes for example includes utility use in communal areas, and purchased goods and services (Scope 3 category 1) for example which might be used for repair, maintenance or retrofit of these homes. However, the tenants’ energy bills (and the reductions from these energy saving measures) are not estimated or included within this report.
Glossary
- ADC -Ashfield District Council
- AMR - Automated Meter Reading
- Baseload - Energy consumption when a building is unoccupied and, for utilities used for heating,when heating degree days equal 0. This is the load which is always there and never switched off.
- BAU - Business as usual
- CHP - Combined heat and power
- CMP - Carbon Management Plan
- CO2 - Carbon dioxide
- CO2e - Carbon dioxide equivalent emissions
- GHGG - Greenhouse gas
- Gross emissions - Overall greenhouse gas emissions. These can be reduced through taking measures to reduce, for example, electricity or gas consumption
- HDD - Heating Degree Day. A measure of how far below and for how many days the outside air is below 15.5 C. For example, if the outside air temperature is 14.5 C for 2 days, this would be 1 degree * 2 days = 2 Heating Degree Days. These are added up to give a total for a certain period (e.g. month, year). Used to help quantify likely demand for energy needed to heat a building
- KPI - Key Performance Indicator
- NI185 - National Indicator 185 (CO2 reduction from local authority operations) included Scope 1 and 2 emissions. The set of national indicators included 198 indicators, of which Local Strategic Partnerships (usually led by local authorities) were required to set targets against 35. The national indicators were introduced in 2008 and abolished in 2010.
- Net emissions - Reported in addition to the gross emissions. Net emissions reflect reductions which are not reflected in the total emissions, for example, exporting renewable energy generation
- Organisational boundary - The border of a company’s own operations and influence
- PV - Photovoltaics
- ULEV - Ultra Low Emissions Vehicles.
Report Details
Report written by Nottingham City Council Energy Services
02/07/2021
Address/client: Ashfield District Council, Urban Rd, Kirkby in Ashfield, Nottingham NG17 8DA
Report authors
Rachel Unwin, Performance and Monitoring Officer Michael Suddens, Carbon Neutral Policy Officer
Quality Assurance
Katie Greenhalgh, Energy Projects Manager
Ashfield District Council (ADC) set out a vision in 2010 to become ‘one of the best and greenest councils in the UK and East Midlands, delivering on sustainability and meeting its climate change targets’ and with this the 2010 Carbon Management Plan (CMP) set the target to reduce ADC emissions by 35% from 2008-9 baseline by April 20156.
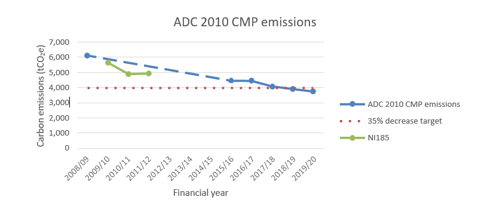
This included baseline data collected for National Indicator (NI) 185, with additional categories, such as waste, fugitive emissions, employee commuting, business travel, water use, and utility consumption in other outsourced assets. Based on the emissions calculations later in this report for the equivalent categories as the original CMP report, by April 2015 a 27% reduction was achieved7.
In July 2019, ADC committed to do everything possible to combat climate change, including committing to a robust climate change strategy.
Since the 2010 target and the 2019 commitment, ADC have delivered a number of different projects, helping them on their journey to reducing the Council’s operational emissions. These include:
| Achievement | Achievement description |
|---|---|
| Sustainability Assessments | Sustainability assessments, implications and impacts are now included in all relevant decisions and reports to committees. |
| Energy Analysis |
Nottingham City Council commissioned to carry out: energy audits and data analysis, solar PV desktop studies and detailed analysis into viable PV projects. |
| Council Scope 1, 2 and 3 emissions baseline | Nottingham City Council commissioned to calculate and analyse ADC’s full scope 1, 2 and 3 baseline for the Council’s own operations. |
| Climate Change Officer Working Group | Open to all departments, key attendees from officers that have the most direct impact on climate change. This includes officers from: Assets and Investments, Place and Well Being, Waste and Environment, Planning and Building Control, Procurement and Finance. |
| Partnerships | ADC collaboratively works with other councils, Local Energy Partnership (LEP), Midlands Energy Hub (MEH), Local Authorities Energy Partnership (LAEP), Department of Business, Energy and Industrial Strategy (BEIS), APSE Energy, Nottinghamshire Lead Energy Officers Group. These partnerships enable ADC to share ideas and knowledge, working collaboratively to meet common goals. |
| Area Wide Emissions | Analysis of indicative emissions for the Ashfield DC local area, through BEIS data for local authorities, Tyndall Centre Carbon Budget Tool and the SCATTER tool. |
| Employee Surveys | Surveys to gather employee views and ideas for carbon emissions reductions and to gather data on employee commuting habits. |
| Energy Provision | Procure green, clean electricity and renewed all ADC energy frameworks in 2020. |
| Environmental | Nearing the completion of an Environmental Charter; successful bids for Towns Fund funding to facilitate cleaner and greener Towns and infrastructure, encouraging increased walking and cycling; planting 1000 trees per year (2020 to 2023). |
| Waste and Recycling | Responded to the Government’s Waste Strategy, refined the Council’s approach to waste to ensure it will meet and hopefully exceed 2023 targets – jointly with Veolia, the County and all other District Councils. |
| Non-domestic Assets | Successful bid for funding from the Public Sector Decarbonisation Fund, for solar PV; on-going review into non-domestic assets, maximising usage of assets and reducing ADC’s carbon footprint. |
| Planning | Developing a Local Plan to incorporate climate change requirements |
| Procurement | Reviewed strategic procurement and contracts to maximise efficiencies and cost avoidance, with an on-going consideration of the implications and impacts on the environment. |
| Buildings and Offices | Transitioned to smarter working, alongside the Council’s review of office space, resulting in reduced office accommodation requirements. In addition, ADC is developing a self-serve approach for frontline services and facilitating remote access/electronic communications to reduce travel for customers; carbon and energy savings on paper purchase, printing and disposal/recycling requirements. |
| Flood Protection | Worked with Nottinghamshire County Council to install flood protection measures to Council and privately owned properties considered ‘at risk’. |
6 For the emissions reported by ADC in 2008-2009.
7 The original 2010 CMP target and baseline were reported in CO2, whilst later NI185 and the analysis within this report are calculated in CO2e. CO2e emissions will be slightly larger than CO2 emissions, and slightly greater than the 27% reduction may therefore have been achieved in April 2015.
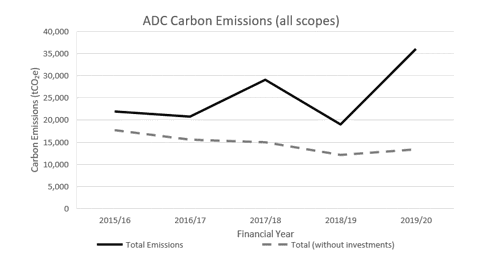
Ashfield District Council total net carbon emissions (for all scopes)8 in 2019/20 were 36,137 tCO2e, 64% more than in 2015/16.
This increase is as a result of Scope 3 investment emissions (see Scope 3 category 15 investments section). Removing investment emissions from this total demonstrates that for all other scopes and categories, ADC emissions reduced by 24% since 2015/16, with an annual average reduction of 6.1%.
Total net carbon emissions for ADC (including investments) equates to 63.3 tCO2e per ADC employee, an 87% increase since 2015/16. Not including investments, this is 23.5 tCO2e per employee, a reduction of 14% since 2015/169.
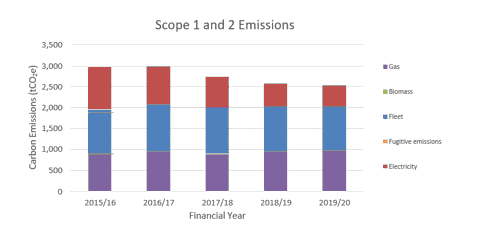
Scope 1 and 2 emissions for the Council include direct emissions from ADC controlled sources and indirect emissions from the generation of purchased energy.
Between 2015/16 and 2019/20 financial years, ADC reduced scope 1 and 2 emissions by 14.8%. These emissions are broken down further by their source in the graph below. Over this same period, gas emissions have increased by 11%, whilst fleet emissions have reduced by 4% and electricity emissions by 50%.
In 2019/20, these emissions accumulated to 2,531 tCO2e, 7.0% of ADC’s full carbon footprint (19% of ADC’s carbon footprint, not including investments). Emissions from fleet use contributed the largest proportion of these emissions (41%), followed by gas use (39%), electricity use (20%) and biomass use and fugitive emissions (<1%).
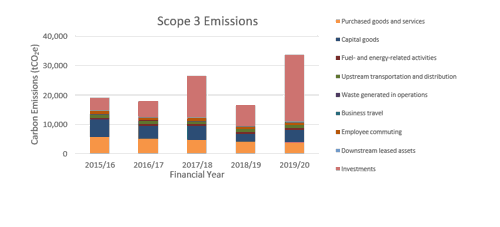
Since 2015/16, ADC Scope 3 emissions have increased by 77% to 33,607 tCO2e in 2019/20. This increase is as a result of changes to ADC scope 3 investment emissions (See Section 5: Scope 3 category 15 investments). If investment emissions were removed from this total, the remaining scope 3 emissions have reduced by 26% since 2015/16. ADC scope 3 emissions are split by source in the graph below. 2019/20 scope 3 emissions were dominated by investments (68%), followed by capital goods (12%), purchased goods and services (12%), upstream transport and distribution (3%), employee commuting (3%) and all other categories (2%)10. Of the Scope 3 emissions categories, it should be noted emissions from investments and capital goods can fluctuate to a much greater extent year-on- year due to particular investments or large scale purchases in a particular year. This affects the trend in overall emissions seen.
8 See Appendices 1 and 2 for explanation of gross emissions, net emissions and total net emissions presented in this report.
9 Over this same period the number of employees has reduced from 650 to 571 (12% reduction)
10 See each category in section 5 for changes to category emissions since 2015/16
Fleet emissions
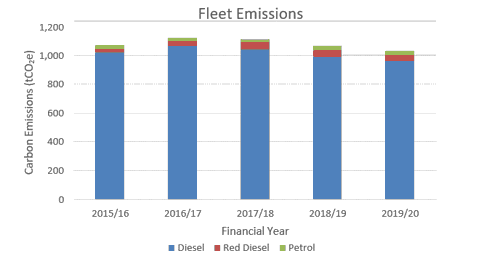
In 2019/20, emissions from fleet accounted for 40.8% of ADC’s Scope 1 and 2 emissions (1033 tCO2e). Fleet emissions have reduced by 3.8% compared to 2015/16, despite a 2.4% increase in the total number of fuel claims. The 2019/2020 fleet emissions mix is dominated by 93.3% diesel, 3.9% red diesel and 2.9% petrol, similar to the last 5 year period.
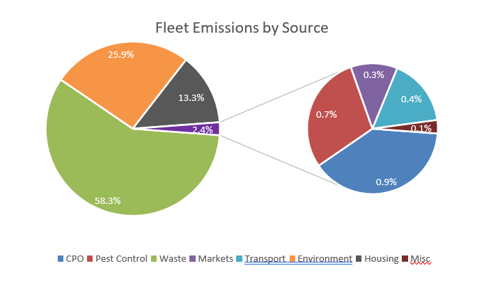
Fleet emissions can be split further based on each ADC service that use fleet vehicles. The Waste service dominate the fleet emissions sources (58.3%), alongside Environment (25.9%) and Housing (13.3%), with other sectors making up the remaining 2.4% of emissions.
Gas emissions
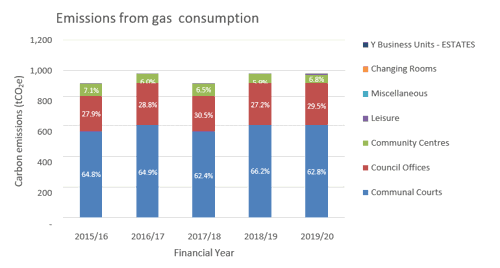
In 2019/20, emissions from gas consumption accounted for 38.7% of ADC’s Scope 1 and 2 emissions.
There was no gas consumption data for the Ashfield Homes sites for 2015/2016 and up to October 2016. This data has therefore been estimated from a calculated monthly average for these sites for data up to March 2020. Similarly, for other sites with missing historic utility data, a monthly average per site has been back filled.
In 2019/2020, the Housing ‘Sheltered accommodation’ Courts accounted for 62.8% of emissions from gas consumption, Council Offices 29.5% and Community Centres 6.8%. As with electricity consumption, these relative proportions have remained similar for the past 5 years. Gas emissions have however increased by 11.8% from 2015/2016 to 2019/2020. The reasons for this are explored further in the following trend analysis (Section 4).
Individual high gas consumption buildings have been further analysed in the Energy Consumption Analysis report completed November 2020 by NCC Energy Services. This found 15 sites accounted for approximately 90% of the estate’s total gas consumption. As would be expected, this includes the larger Offices, the Northern depot, and the Housing ‘Sheltered accommodation’ courts.
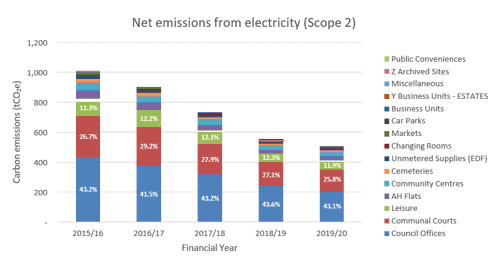
Electricity emissions
In 2019/2020, emissions from electricity emissions accounted for 20.0% of ADC’s Scope 1 and 2 emissions. As with gas consumption, there was no electricity consumption data for the Ashfield Homes sites for 2015/2016 and up to October 2016. This data has therefore been estimated from a calculated monthly average for these sites for data up to March 2020. Similarly, for other sites with missing historic electricity data, a monthly average per site has been backfilled.
In 2019/2020, Council Offices accounted for 43.1% of net electricity emissions, Communal Courts 25.8%, Leisure11 11.9%. These proportions of emissions have been similar for the past 5 years, however between 2015/2016 and 2019/2020, net electricity emissions12 have decreased by 49.9%. The reasons for this are explored further in the following trend analysis.
Individual high electricity consumption buildings have been further analysed in the Energy Consumption Analysis report completed November 2020 by NCC Energy Services. This found 16 sites accounted for approximately 75% of the estate’s total electricity consumption.
Biomass emissions
In 2019/2020, emissions from biomass accounted for 0.3% of ADC’s Scope 1 and 2 emissions. ADC have two biomass boilers at Titchfield Court and Sherwood Court, which use wood pellets with gas back- up. The emissions from the gas back-up are captured within the gas emissions. In 2019/2020, 83% of the biomass emissions are from the Sherwood Court biomass boiler, consistent with the greater mass of wood pellets burnt.
Fugitive emissions
In 2019/2020, fugitive emissions accounted for 0.2% of ADC’s Scope 1 and 2 emissions. Fugitive emissions are from fleet air conditioning units, air conditioning units (in buildings), and fridges. Fleet air conditioning units account for 97% of fugitive emissions. As there is no change in the number of air conditioning units since 2015/2016 to 2019/2020, this is the case for each year in the reporting period.
11 Leisure site group excludes leisure centres, as utility consumption is paid for by the leisure centre operator.
12 Emissions for Ashfield District Council’s operational estate from electricity consumption, excluding electricity consumption from solar PV generated onsite.
Fleet emissions trend analysis


The below graphs demonstrate that ADC fleet emissions fluctuate seasonally, with higher emissions during Spring and Summer months, compared to Autumn and Winter months. This can be explained by looking at the total number of fleet vehicles in operation during each month, which increase during Spring/Summer and decrease during Autumn/Winter. This is demonstrated by the highly correlated emissions data with the number of fleet vehicle in 2019/20. This is caused by an increase in fleet vehicles, such as agricultural and ride-on mowers, during the warmer Spring and Summer months, which are not used/used less during Autumn and Winter.
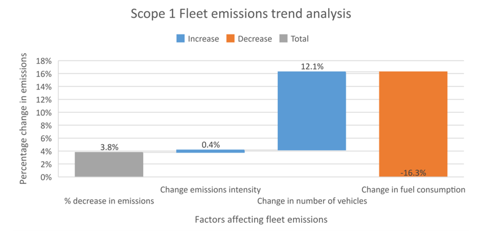
Since 2015/16, there has been a 3.8% decrease in emissions from fleet vehicles. This is a result of a 4.2% decrease in overall fuel consumption, balanced with a small (0.4%) increase in fuel emissions intensity. Of the 4.2% decrease in overall consumption, 16.3% is due to a decrease in fuel consumption, whilst there has been a 12.1% increase in the number of vehicles.
Grid decarbonisation
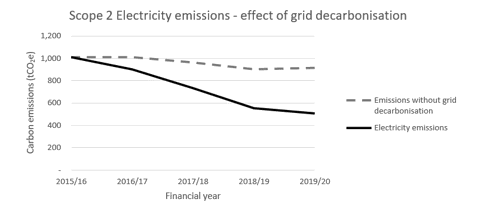
The net carbon emissions presented in this report incorporate annual changes in the carbon intensity of the national electricity grid, as recommended by the GHG Protocol. It is important to note that between 2015 and 2019, the carbon intensity of the UK electricity national grid has decreased by 45%. This is known as greening of the grid.
During this time, Ashfield District Council’s emissions from electricity have decreased by 50%. Of this 50% emissions reduction observed, 81% of this is due to greening of the grid, and the remaining 19% is due to reductions in electricity consumption. This has been assisted by an increase in electricity generation on site during this period.
The national grid carbon intensity factor is expected to continue to decrease as the mix of electricity sources nationally become lower carbon. If ADC maintains the same electricity consumption this would result in lower emissions in future years13. Equally, reductions in electricity consumption in the future would have less of an impact than in previous years on reducing ADC carbon emissions, due to the greening of the electricity grid.
Changing assets
Of the 9.4% decrease in electricity consumption observed (as noted above in Grid Decarbonisation), 30.2% of this is due to changes in the number of assets included in the ADC estate.
Under the operational control boundary, buildings which are under ADC’s operational control are included in the Scope 1 and 2 emissions figures, whilst those which are financially owned by ADC, but for example leased out, are included within ADC’s Scope 3 Downstream Leased Assets category.
As new buildings have also been invested in and come under ADC’s operational control since 2015/16, these have been included in ADC’s figures. Similarly, buildings which have been leased out, or sold, have moved out of ADC’s Scope 1 and 2 emissions.
This shifting asset list has impacted upon ADC’s Scope 1 and 2 emissions, although have only impacted upon electricity consumption, as no sites with gas consumption have been affected by changing assets.
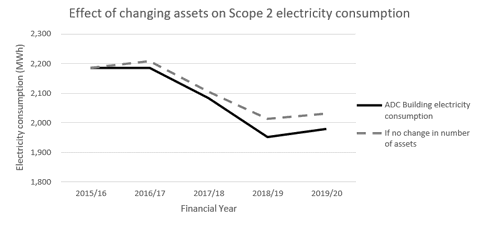
5 sites with electricity consumption have been added (2 in 2016, 1 in 2017, 1 in 2018, 1 in 2019). These have collectively added an average annual consumption of 5.0MWh by 2019/2020 (1.28tCO2e). However, 13 sites with electricity have been lost from Scope 2 (2 during 2015/2016, 4 in 2016/2017, 1 in 2017/2018, and 6 in 2018/2019). Collectively, these had 130.6MWh electricity consumption in 2015/2016. The number of assets at the end of 2019/2020 was 191.14
If there had been no change in number of assets during the reporting period (2015/2016 – 2019/2020), electricity consumption may have been as shown in the graph15.
Weather
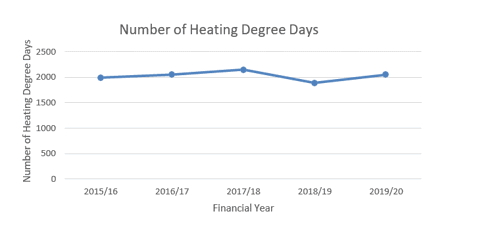 The weather we experience each year varies, which can significantly affect emissions from gas consumption. For instance, a colder winter will result in more fuel being used for heating; whilst a warmer winter will have a lower demand for heating, meaning less fuel is used and fewer emissions as a result. The change in the weather experienced can be measured with Heating Degree Days (HDD). A heating degree day is a measure of how far below and for how many days the outside air is below a certain temperature. The graph shows the number of heating degree days per year for 15.5oC for the East Pennines region, where it is clear 2018/2019 financial year was a warmer year than average.
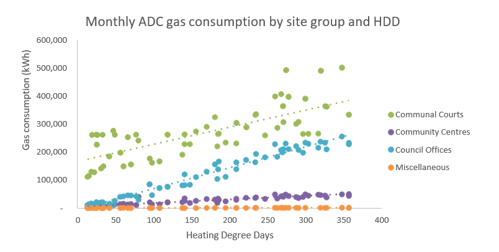
Analysing these heating degree days against the energy consumption for Ashfield District Council site groups of buildings suggests communal courts, community centres, council offices and miscellaneous are all dependent on weather for the quantity of gas used. Overall, these sites’ gas consumption can be considered on average 60% weather-dependent and 40% base load.
Plotting gas consumption against HDD for Leisure, Business Units, and Changing Rooms (not shown) does not show a correlation, suggesting other uses of gas, poor controls or misuse/override which may need further investigation.
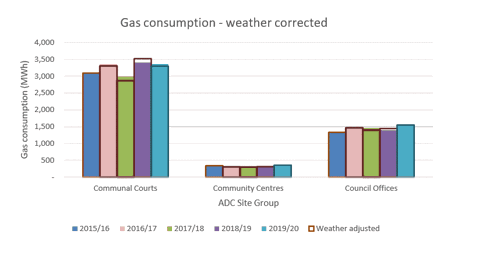
The graph indicates how accounting for the weather impacts the emissions profile for gas for the site groups which have the majority of ADC’s consumption. Solid bars show the recorded gas consumption, whilst the open bars indicate what these would be if corrected for the weather, based on the average weather-dependency for these sites. As in most cases the bar heights are similar, adjusting for weather has little impact on the trends seen in gas consumption, and therefore emissions. Overall, when gas use is adjusted for the weather, gas consumption has still increased by 10% (rather than 12%). As the carbon intensity of gas emissions has stayed constant over the years, this has a similar impact on gas emissions (10% increase when weather-adjusted, 12% increase without weather corrections). This demonstrates that of the 12% increase in gas emissions observed, 16% is due to changes in the weather, with the remaining 84% due to other increases in gas consumption16.
For electricity, however, the vast majority of consumption is not affected by varying amounts of heating due to the weather (average 75% of electricity consumption is baseload).
Renewables
Ashfield District Council have installed numerous solar installations across their estate, as well as three CHP systems, and two biomass boilers17. As a result, Ashfield has been able to use local low carbon electricity and heat instead of using it from the national grid, saving both money and carbon.
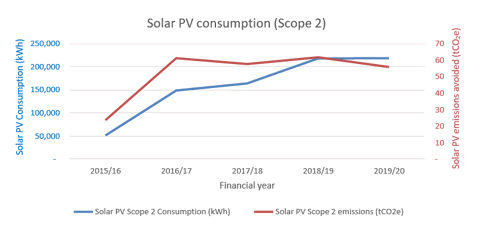
The rate of electricity consumption18 from local solar has risen by 428% since 2015/2016 to 218,411 kWh in 2019/2020. Looking at the trend in CO2e saving per year from these installations, it is clear that the trend initially followed a similar trend to the annual solar PV consumption. Most recently, this carbon saving has started to slow and level off. This is due to the greening of the grid making the emissions difference between local generation and the national grid smaller. Despite this, 55.8 tCO2e was prevented in 2019/20 due to consumption of local solar PV generation. This accounts for 7.7% of the decrease in electricity consumption seen between 2015/2016 and 2019/2020.
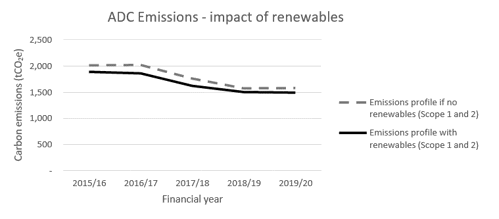
Without these renewable installations (solar, CHP, biomass boilers), emissions from electricity and gas are estimated to have been on average 7% higher than with the installations.
Electricity emissions trend analysis summary
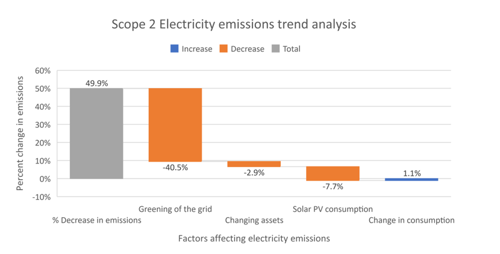
Combining the above trend analysis for electricity indicates of the 49.9% decrease in emissions from electricity consumption observed from 2015/2016 to 2019/2020, 40.5% is due to greening of the grid, 7.7% due to an increase in consumption of solar PV electricity, 2.9% is due to a change in the number of assets. These decreases mask that the remaining changes are due to a 1.1% increase in electricity consumption that has also occurred during this time period.
Gas emissions trend analysis summary
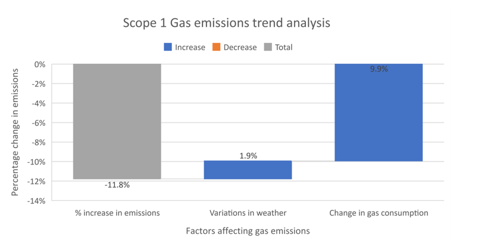 Gas emissions have increased by 11.8% from 2015/16 to 2019/20. 1.9% of this increase is due to the weather experienced, with the remaining 9.9% due to other increases in gas consumption. This may be due to a variety of factors, which would require further investigation. Possible reasons are covered further within the Energy Consumption Analysis Report completed November 2020 by NCC Energy Services.
Business as usual projections
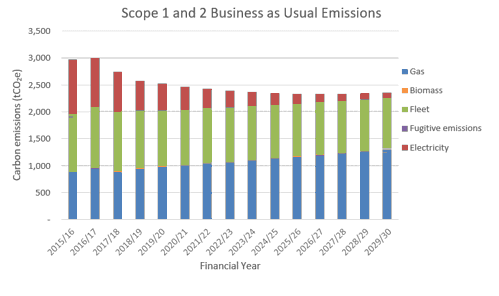
Based on scope 1 and 2 historic emissions trends, future emissions can be extrapolated out to 2030 to demonstrate ADC’s business as usual emissions. The graph below demonstrates ADC scope 1 and 2 emissions would remain at 2,353 tCO2e in 2029/2030, just 21% less than in 2015/2016. Electricity emissions would reduce by the greatest amount (<100 tCO2e remaining in 2029/2030), in line with trends discussed in Section 4. Fleet emissions would also reduce slightly (12% lower than in 2015/2016), meanwhile gas emissions would increase, in line with the historic increase in ADC gas emissions. The resulting impact of this is that emissions would continue to decrease until 2027/2028, after which emissions will begin to increase, due to the annual increase in gas emissions going above the annual reduction in electricity and fleet emissions.
13 Electricity emissions presented in this report are calculated using a location-based approach. The Government's Environmental Reporting Guidelines require that Scope 2 electricity emissions are reported using location-based grid average emissions factors. The location-based emissions reflect the average emission of the grid where the energy consumption occurs and is calculated using UK Electricity grid average factors, used within this report. However, market-based emissions reflect a contractual entitlement to claim an emissions rate, allowing for a reduced emission figure where, for example, a renewable energy tariff is backed by certificates to track attributes associated with energy generation. Ashfield District Council switched to a green tariff for half hourly sites from October 2020, and all other non-domestic non-half hourly sites from April 2021. This reduced market-based figure can be reported in addition to the location-based approach in future years.
14 At some points during each year, the number of assets may have been higher, and electricity use for all sites under the Scope 2 boundary have been included in calculated emissions for the portion of the year they were in scope.
15 This takes total electricity consumption, divided by number of assets in that year, and multiplied by number of assets in 2015/2016. This therefore ignores improvements in efficiency, and focuses on changes as a result of loss and gain of sites.
16 These weather-dependent relationships are explored further for individual high usage sites in the Energy Consumption Analysis reports.
17 CHP systems at Langton Court and Beauvale Court, Micro CHP at Desmond Court, Biomass boilers at Titchfield Court and Sherwood Court
18 Solar PV generation minus PV exported to the grid
Category 1: Purchased goods and services
Emissions from purchased goods and services accounted for 11.9% of total Scope 3 emissions in 2019/2020 and 11.1% of Ashfield District Council’s overall Scope 1-3 footprint. Since 2015/2016, emissions from purchased goods and services have decreased by 32%.
Spend data has been categorised by SIC code19, and covers 37 of these. Emissions from 23 of the SIC code categories have less than 1% share of total emissions each year, and sum to between 4.6-5.8% each year; these have been grouped as ‘Other’ in the graph below.
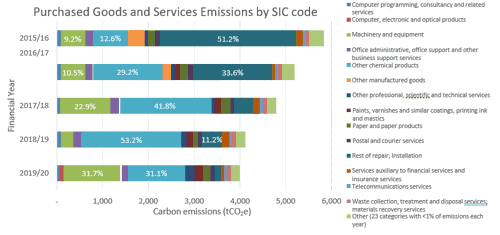
In 2015/2016, over half of emissions (51.2%) were from repair and installation (2990.7tCO2e).
In 2016/2017, repair and installation similarly accounted for a large proportion of emissions (33.6%), as well as other chemical products (29.2%).
In 2017/2018, repair and installation no longer contributes the most emissions, rather Other chemical products (41.8%) and machinery and equipment (22.9%).
In 2018/2019, over half of emissions were from purchase of Other chemical products (53.2%).
In 2019/2020, the greatest emissions contributions were again split between Other chemical products (31.1%) and machinery and equipment (31.7%).
Data in this category is calculated from spend data for purchased goods and services, and water meter data for water supply20. The calculation of emissions related to water supply is considered robust, however there are large limitations in the spend data used for calculating emissions from the remaining goods and services. Going forwards, acquiring more supplier-specific data (e.g. quantity or mass of units purchased) will enable improvements in this area to be calculated and reported more accurately.
Category 2: Capital goods
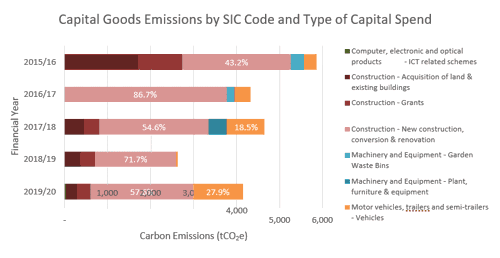
Emissions from capital goods accounted for 12.3% of total Scope 3 emissions in 2019/2020 and 11.5% of Ashfield District Council’s overall Scope 1-3 footprint.
Total cradle-to-gate 21 emissions of purchased capital goods are all included in the year of acquisition. Major capital purchases in one year can therefore mean emissions from capital goods fluctuate significantly between years. 2018/2019 has much lower emissions from capital goods than other years, this reflects the much lower spend on capital goods in this financial year. Despite this, emissions from purchased capital goods have decreased by 29.2% from 2015/2016 to 2019/2020.
Spend data has been categorised by type of capital spend, which cover 4 SIC codes: Construction; Motor vehicles, trailers and semi-trailers; Machinery and Equipment; and Computer, electronic and optical products.
In all years, over 70% of emissions are from purchase of capital goods related to construction. The largest proportion of these emissions is from capital spend related to new construction, conversion and renovation, accounting for over 70% of these emissions in all years since 2016/2017. In 2015/2016, 48% of emissions from capital goods related to construction, were from new construction, conversion and renovation.
In 2019/2020, after emissions from purchase of capital goods related to construction, emissions from purchase of capital goods related to motor vehicles, trailers and semi-trailers vehicles account for the next largest proportion of emissions (27.9%).
In 2017/2018, 9.6% of capital goods emissions was from plant, furniture and equipment, reflecting the greater spend on this type of capital than in other years. This included spend on a glass recycling project (70.2%) and vehicle tracking system (14.9%).
Category 3: Fuel and energy related activities
Emissions from fuel and energy-related activities accounted for 1.5% of total Scope 3 emissions in 2019/2020 and 1.4% of Ashfield District Council’s overall Scope 1-3 footprint.
These emissions are related to the production of energy, and for electricity, the transmission and distribution losses for purchased energy. Emissions are therefore the result of the gas, electricity, fleet use, and biomass usage, as covered for Scope 1 and 2 emissions22. Emissions for fuel- and energy- related activities have decreased by 16% since 2015/2016. The trends in emissions from fuel- and energy- related activities reflect the proportions of emissions and trends highlighted for these categories earlier in the Scope 1 and 2 emissions trend analysis (Section 4).
Category 4: Upstream transport and distribution
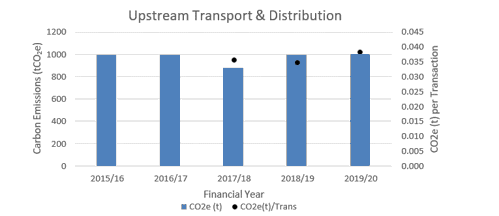
Emissions from upstream transportation of goods accounted for 3.1% of total Scope 3 emissions in 2019/2020 (1027 tCO2e) and 2.8% of ADC’s overall Scope 1-3 footprint.
The distance between the supplier postcode and ADC has been used to calculate journey distances, due to limited data available it is assumed that all UK-derived products have been transported by an average laden HGV. ADC do not hold information for 2015/2016 and 2016/2017 financial years; the data for these years have been estimated based on averages of data for the last 3 year period.
Upstream transportation and distribution emissions have increased 2.79% than estimated 2015/2016 upstream transport and distribution emissions23. Since 2017/2018, upstream transportation emissions have increased each year due to greater total distances being travelled. The last three years of data indicate emissions per delivery into ADC are in the region of 0.035 to 0.038 tCO2e.
Improvements to this data could be made through improving supplier specific data, such as the vehicle and fuel type used to deliver goods and the exact distances travelled. In addition, these calculations do not currently include storage in warehouses and distribution/retail facilities. Including this data would provide a fuller picture of emissions, and would likely increase the percentage share of the total Scope 3 emissions.
Category 5: Waste generated in operations
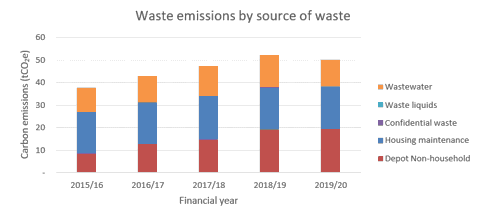
Emissions from waste generated in operations account for 0.1% of total Scope 3 emissions in 2019/2020 and 0.1% of Ashfield District Council’s overall Scope 1-3 footprint. Since 2015/2016, emissions from waste generated in operations has increased by 33%.
Waste data has been categorised by source of the waste, as split by Ashfield District Council. Waste generated in operations also includes waste water. The quantity of waste water is assumed to be the same as the water supplied to Ashfield District Council, however water supply from allotments is excluded from waste water calculations. Housing maintenance waste, depot non-household waste, and waste water collectively account for 99% of waste emissions. Confidential waste and waste liquids account for the remaining 1% of emissions. The emissions associated with running refuse lorries is included within this emissions footprint for Ashfield District Council (Scope 1 Fleet emissions), however the domestic waste collected is not.
In 2015/16, housing maintenance (48%) and waste water (29%) emissions account for the greatest proportion of emissions, with a much lower proportion from depot non-household (22%).
Emissions from depot non-household waste increases from 8.5 tCO2e in 2015/2016 to 19.35 tCO2e in 2019/2020. This is an increase of 129%, and results in 2019/2020 having the greatest proportion of waste emissions from any category being from depot non-household waste.
This increase in emissions is as a result of the increase in waste tonnage, for both general waste and recycling (157% and 33% increases respectively). The emission factors stay broadly consistent year on year, and have little impact on the overall emissions.
In contrast, the emissions from the other predominant categories of waste (housing maintenance, waste water) stay much more constant year on year. The housing maintenance waste was only available for 2019/2020, and has been assumed to be a consistent tonnage for the previous four years. waste water volume has increased by 12% between 2015/2016 and 2019/2020, however in comparison to other waste streams has a much lower emissions intensity, and as a result this increase in waste has less of an impact on overall waste emissions24.
In considering these emissions, it should be noted that only the end-of-life disposal is taken into account in these waste emissions figures, and these should not be used to determine the relative lifecycle merit of different waste management options. This is in line with the Greenhouse Gas Protocol. For example, the benefits of energy recovery and recycling are attributed to the end user of the recovered energy or recycled goods, rather than the waste producer. As such, when considering waste emissions only, both these end destinations have the same emissions intensity (i.e. 1 tonne of general waste and 1 tonne of recycling will both have same volume of waste emissions).
Category 6: Business travel
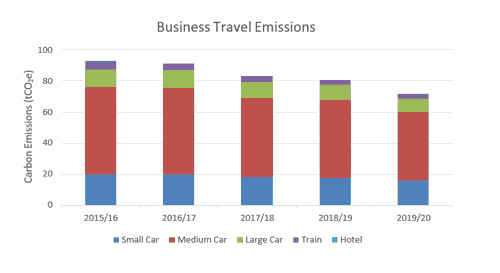
Business travel includes any travel that is required to attend meetings, conferences, training and running of key council services (e.g. home visits), as well as emissions from staying in hotels. Emissions from business travel account for 0.2% of total Scope 3 emissions in 2019/2020 and 0.2% of Ashfield District Council’s overall Scope 1-3 footprint.
ADC’s business travel emissions in 2019/2020 equated to 71.65 tCO2e. This can be broken down further by the mode of travel, which demonstrates that car journeys dominate the emissions mix, with a 96% share of business travel emissions from 241,271 claimed miles. The remaining 4% of emissions came from an estimated 43,682 miles of rail journeys in 2019/2020, as a result of the low carbon nature of train travel compared to using a car.
Car journeys can be separated out further, assuming the same mix in employees’ cars for business travel as for commuting, to demonstrate that 16.9% of business travel emissions come from small cars, 47.5% from medium cars, and 9.5% from large cars.
Overtime, ADC emissions from business travel have reduced by 23% since 2015/2016. All forms of business travel have reduced alongside this reduction in emissions: 53,220 fewer miles were claimed for car journeys (saving 20% of emissions), £5,450 less was spent on rail journeys (saving 2.4% of emissions) and ADC no longer have any hotel stays (saving 0.6% of emissions).
Further business travel may occur by bicycle or foot, however these have no associated carbon emissions.
Category 7: Employee commuting
Emissions from employee commuting account for 2.8% of total Scope 3 emissions in 2019/2020 and 2.6% of Ashfield District Council’s overall Scope 1-3 footprint.

A 2020 survey demonstrated how 138 ADC employees (24.2% of all ADC employees) commuted to work. The results of this survey show that single occupancy car journeys were the most common method of transport (92.5%), followed by Tram (4.1%), Bus (2.1%, Motorbike (0.8%) and Walking/Cycling (0.6%)25.
ADC employee commuting emissions have been calculated using the results of this survey and scaling up the survey emissions to represent the full ADC workforce. In 2019/2020, ADC commuting emissions were 935.71 tCO2e.
When broken down into mode of transport, single occupancy car journeys make up the majority of ADC commuting emissions (97.9%). Large cars make up 12.6% of these emissions, medium cars 62.9% and small cars 22.3%26. The remaining commuting emissions result from Bus (1.5%), Motorbike (0.5%) and Tram (0.1%) journeys.
Over the last 5 years ADC commuting emissions have reduced by 15.4% since 2015/2016. 79% of this emissions reduction is due to a decrease in the number of ADC employees and 21% reduction in the emissions intensity associated with different transport modes27, between 2015/2016 and 2019/2020.
It is clear that for ADC to reduce its employee commuting emissions, efforts must be made to reduce single occupancy car journeys, encouraging employees to, where possible, walk or cycle to work or use low carbon transport, such as the bus or tram.
Category 13: Downstream leased assets
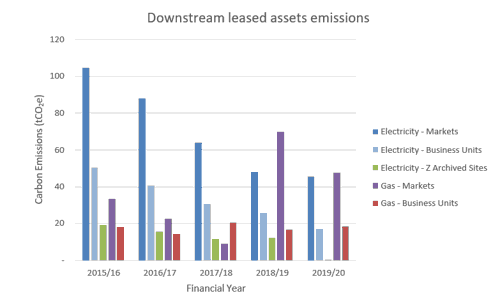
Emissions from downstream leased assets account for 0.4% of total Scope 3 emissions in 2019/2020 and 0.4% of Ashfield District Council’s overall Scope 1-3 footprint. Since 2015/2016, emissions from downstream leased assets have decreased by 42.7%.
Downstream leased assets consists of emissions from the operation of Ashfield District Council’s owned assets leased out to external parties. Under an operational organisational boundary, anything the council operates through a lease from an external company (category 8) will fall under scope 1 and 2. Meanwhile, assets the council owns but leases out to external parties fall under category 13 of scope 3. Where ADC have responsibility for the utility bills of downstream leased assets, the costs will be either recharged to the leaseholder(s) or the cost will be covered under a service charge to the leaseholder(s).
Ashfield’s downstream leased assets which there is data for includes gas and electricity consumption. It is assumed none of these assets have refrigeration or air conditioning units.
As discussed in the utility trend analysis for Scope 1 and 2 emissions, the emissions from downstream leased assets could also be affected by grid decarbonisation (electricity), weather, renewables (solar PV), as well as changing levels of gas and electricity consumption at the sites.
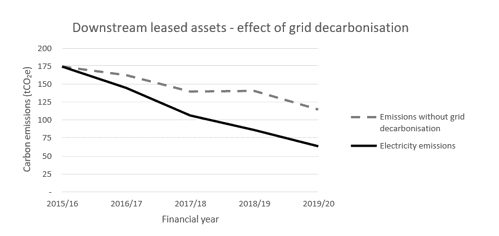
Downstream leased assets electricity emissions have decreased by 64% between 2015/2016 and 2019/2020, and of this, 46.1% has been due to grid decarbonisation, with the remaining 53.9% due to other changes in consumption. Additionally, 1 business unit (of 4), and 1 former site (of 2) have been lost during 2019/2020 from the downstream leased assets category, reducing electricity consumption (no impact on gas consumption).
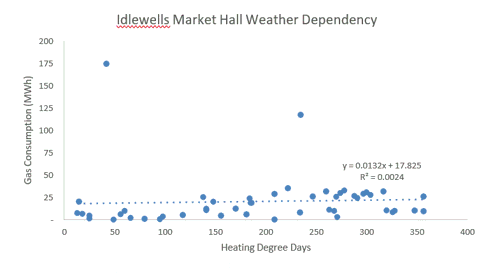
Downstream leased assets emissions from gas consumption have increased by 28% between 2015/2016 and 2019/2020. Gas consumption had been decreasing between 2015/2016 and 2017/2018, however a significant increase in Idlewells Markets Hall (Markets site group) gas consumption in 2018/2019 and 2019/2020 has resulted in increased emissions. This site is considered further in the Energy Consumption Analysis – Gas report, however it should be noted, this analysis considers only from April 2018 onwards, and thus whilst recognises the significant subsequent decrease from August 2019 onwards, does not note this sustained period of high usage during 2018/2019 as an anomaly compared to prior years. Analysis of the weather dependency of this site over the 5 years suggests there is not a correlation between weather and gas consumption28, suggesting other uses of gas or poor controls (units are sub-let by ADC to small businesses) which may need further investigation.
Category 15: Investments
Emissions from investments account for 67.6% of total Scope 3 emissions in 2019/2020 and 62.9% of Ashfield District Council’s overall Scope 1-3 footprint. Since 2015/2016, emissions from investments have increased by 438%.
In the Greenhouse Gas Protocol, investments are split into 5 categories:
- Equity investment and debt investment without known use of proceeds
- Project finance and debt investments with known use of proceeds
- Project finance (where initial sponsor/lender)
- Managed investments and client services
- Other investments or financial services
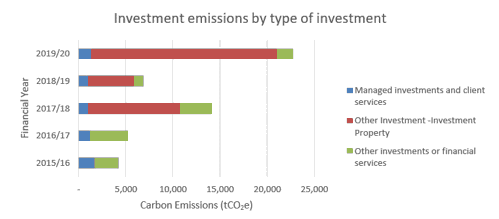
Data for the last 2 of these have been provided by Ashfield District Council and are included in the estimate of emissions from investments. Based on the data received, other investments or financial services has been further split into investment properties, and remaining other investments or financial services.
Emissions from managed investments and client services remains broadly consistent year on year in comparison to the other categories. These emissions have decreased by 21% from 2015/2016 to 2019/2020. All emissions in this category are from financial inter-mediation.
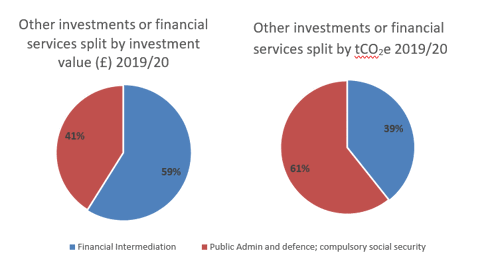
Emissions from other investments or financial services also decreased by 34% from 2015/2016 to 2019/2020. This reflects a 45% decrease in these investments over the same time period. In 2019/2020, 59% of these investments were from investing in the financial inter-mediation sector, and 41% from public admin and defence, and social security. Due the comparatively lower emissions impact of financial inter-mediation sector however, this only accounts for 39% of the emissions from other investments or financial services.
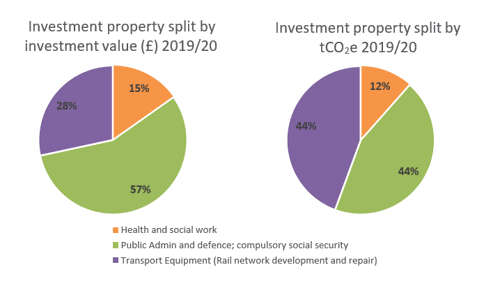
IMAGE - Grph - Investment Property Split By Investment Value And By Tco2 2019 To 2020
There were no emissions from investment properties in 2015/2016 and 2016/2017, however from 2017/2018 onwards they account for over 2 thirds of investment emissions each year, and rising to 87% of investment emissions in 2019/2020. The emissions values reflect the quantity of investment spend in these years. In 2019/2020, the greatest investment by value was properties in the public admin and defence, and social security sectors (57%), then transport equipment (28%), and properties for health and social work (15%). Due to the comparatively higher emissions impact from the transport equipment sector however, there is the joint highest impact in emissions from both investments in transport equipment, and the public admin sectors (44% each). Property investments in the health and social work sector account for the remaining 12% of emissions.
19 UK Standard Industrial Classification 2007 of economic activities
20 Emissions from supply of water account for 0.2% of emissions from purchased goods and services in 2019/20, and less than 0.1% of total ADC emissions (Scopes 1-3). For further detail on water emissions, see Appendix 5.
21 Cradle-to-gate refers to the upstream life cycle of a product from resource extraction (cradle) up until it leaves the factory (to be transported to the customer/reporting organisation).
22 Scope 1 and 2 emissions for the Council include direct emissions from ADC controlled sources and indirect emissions from the generation of purchased energy
23 These calculations should be treated as indicative, where an improvement to reduce upstream transport and distribution may not be picked up in this estimation method.
24 It is assumed that water supply to allotments has no corresponding waste water
25 ADC employee commuting mix is presented as a percentage of the total number of commuting days per week, taking into account the mode of transport and the number of days ADC employees commute per
26 Size of car engine determines the split between small, medium and large cars, as outlined in: website: BEIS conversion factor methodology.
27 2020 commuting mix remains unchanged throughout the 5 year period.
28 This is also the case if ignore the two anonymously high readings for June 2018 and February 2019.
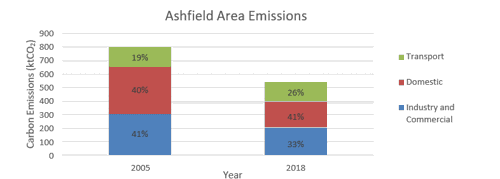
Ashfield District’s area Scope 1 and 2 emissions accounted for 536 thousand tonnes of carbon dioxide (ktCO2) in 201829, 33.2% less than in 2005. The 2018 emissions mix was 41% domestic, 33% industrial and commercial, and 26% from the transport sector. This demonstrates that the domestic share of emissions has stayed relatively the same since 2005, compared to a reduction in industrial and commercial emissions and an increase in the transport sectors share. Ashfield area’s Scope 1, 2 and 3 emissions were 770 ktCO2e in 201830.
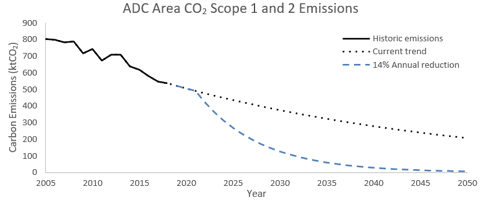
Over the last 14 year period, Scope 1 and 2 emissions have on average reduced by 2.94% per year. If this trend was to continue Ashfield area emissions would still be 375 ktCO2 in 2030 and 206 ktCO2 in 2050. This demonstrates the need for Ashfield’s area emissions to reduce at a greater rate and magnitude than the historic trend.
The Tyndall Centre suggests the Ashfield area has a carbon budget of 4 MtCO2 for Scope 1 and 2 emissions between 2020 and 2100. If Ashfield emissions continued on the historic trend, this budget would be used up during 2028. All emissions past this point would be contributing to a dangerously warmer world. In order to keep emissions below this carbon budget and achieve net zero emissions by 2050, in line with national targets, annual emissions reduction rates must be in the region of 14% per year, from 2022 to 2050.
29 These emissions account for scope 1 and 2 area emissions as identified by BEIS CO2 emissions for local authorities
30 These emissions account for scope 1, 2 and 3 area emissions as identified by SCATTER CO2e emissions for local authorities. This uses some different source data to the BEIS inventory, and is not directly comparable.
Contracted by Ashfield District Council, NCC Energy Services have also completed:
- Energy analysis report, analysing past energy consumption across the highest consuming sites in the Ashfield Council
- Solar feasibility studies outlining 2 clear cases installing solar PV systems at Hucknall Leisure Centre and Lammas Leisure Centre. Additionally, further preliminary proposals are outlined for other sites as part of the Ashfield estate31.
- A series of 6 energy audits across the Ashfield District Council internal property portfolio (key archetypes), assessing the current efficiency status of the selected properties and recommending improvement measures to save money and reduce carbon emissions with a view to enabling a more sustainable portfolio to be developed going
For the energy analysis report, key recommendations on monitoring have been made, which are included in Section 9. The energy analysis report is intended to prompt investigations into gas or electrical equipment and controls at the various sites. In some cases this identifies where there may be an opportunity to improve the efficiency of the building, and in others identifying a recent change that has taken place which has impacted the energy consumption. Investigating these may help to reduce energy consumption, and thus carbon emissions.
Not all increases in consumption are indications of a problem, e.g. if occupancy levels or opening hours of a building have increased due to business needs then energy usage will likely follow suit. However it is then important to re-baseline the site’s consumption so that this extra ‘necessary’ consumption is taken into account.
Understanding why the energy usage changed is key to correcting extant issues, preventing reoccurrence of past issues and knowing which measures/initiatives have provided meaningful reductions for both energy and carbon.
The main carbon saving recommendations from parts 2 and 3 of the wider NCC Energy Services contracted works are summarised in the table below with their potential carbon savings32. Note, this is based on singular measures and calculations do not include interdependencies between measures so figures demonstrate an absolute maximum. A full implementation plan would be required if ADC wanted the actual achievable based on order of installation. Further information on the recommendations are included within the respective reports.
To note, this only includes the carbon savings included within the above listed NCC Energy Services’ works, and is not an exhaustive list of carbon recommendations for the full ADC estate. The approach will need to be replicated across the remaining estate to establish overall potential savings. The data table also includes key recommendations at Leisure Centres, which are not part of this Carbon Management Plan report.
| Council location | Recommendation | Annual carbon saving (kgCO2e) |
|---|---|---|
| Northern Depot – Admin Building | Replace existing immersion water heater with a gas fired hot water heater | 3,941 |
| Northern Depot – Admin Building | Replace residual non LED lighting with LED equivalents | 1,046 |
| Northern Depot – Admin Building | Replace 2no. mains gas Andrews Water Heaters with Heat Pump Hot Water Cylinders | 4,369 |
| Northern Depot – Building 1 | Install PIR sensors in suitable areas (Toilets and store rooms) | 1,840 |
| Northern Depot – Building 1 | Replace residual non LED lighting with LED equivalents | 1,145 |
| Northern Depot – Building 2 | Install lighting sensors in suitable areas | 6,015 |
| Northern Depot – Building 2 | Replace residual non LED lighting with LED equivalents | 3,695 |
| Northern Depot Site Wide | Improved energy management practice (electricity) | 4,612 |
| Northern Depot Site Wide | Improved energy management practice (gas) | 6,305 |
| Northern Depot Site Wide | Install Solar PV array to South East facing pitched roofs | 16,097 |
| Northern Depot Site Wide | Replace 3 no. roller doors with high performance fast action roller shutters | 11,858 |
| Kingsway park | Improved energy management practice (electricity) | 941 |
| Kingsway park | Install PIR sensors in all suitable areas | 340 |
| Kingsway park | Install a minimum of 300mm mineral wool to pitched roof, flat ceiling joist spaces. | 1,495 |
| Kingsway park | Replace residual non LED lighting with LED equivalents | 3,728 |
| Kingsway park | Install a split unit, air source heat pump to the Café. | 1,922 |
| Kingsway park | Replace existing systems with heat pump water heaters | 3,210 |
| Kingsway park | Install 11.05 kWp Solar PV to South and East facing pitched roof space | 5,508 |
| Watnall Road Community Centre | Replace existing boiler with air source heat pump (air to air) | 7,422 |
| Watnall Road Community Centre | Improved energy management practice (electricity) | 80 |
| Watnall Road Community Centre | Improved energy management practice (gas) | 868 |
| Watnall Road Community Centre | Install timer to hot water heater | 298 |
| Watnall Road Community Centre | Replace residual non LED lighting with LED equivalents | 879 |
| Watnall Road Community Centre | Install 16 kWp Solar PV system | 4,255 |
| Brand court | Improved energy management practice (electricity) | 1,266 |
| Brand court | Install PIR sensors in all suitable areas (Corridors and Stairwells) | 4,214 |
| Brand court | Replace residual non LED lighting with LED equivalents | 4,658 |
| Brand court | Replace Creda Comfortair electric warm air heaters with split unit air source heat pumps in communal area | 4,036 |
| Brand court | Install cavity wall insulation | 16,743 |
| Brand court | Upgrade or install loft insulation to a minimum depth of 300mm | 1,476 |
| Brand court | Replace Creda Sensor Plus storage heaters to flats with high retention storage heaters | 9,981 |
| Brierley Road | Replace existing storage heaters with split unit air source heat pump (air to air) | 7,896 |
| Brierley Road | Install PIR sensors in suitable areas (Toilets and store rooms) | 99 |
| Brierley Road | Replace residual non LED lighting with LED equivalents | 406 |
| Brierley Road | Install 16 kWp Solar PV system on Unit 6 west facing roof | 4,139 |
| Brierley Road | Install 30.4 kWp Solar PV system on Unit D south facing roof | 8,020 |
| Broomhill Cemetery | Install 5.76 kWp Solar PV system on east facing roof | 1,446 |
| Idlewells Market Hall | Install 65.28 kWp Solar PV system | 16,990 |
| Mill House Community Centre | Install 13.12 kWp Solar PV system | 2,781 |
| Watnall Road Offices | Install 11.7 kWp Solar PV system | 2,762 |
| Sutton Lawn Park Visitors | Install 25.6 kWp Solar PV system | 12,910 |
| Council offices | Improved energy management practice (electricity) | 4,324 |
| Council offices | Improved energy management practice (gas) | 6,246 |
| Council offices | Replace existing conventional gas condensing heating system with air or ground source heat pumps | 65,863 |
| Council offices | Install PIR sensors in all suitable areas (Toilets, Meeting / Interview room and Kitchens) | 16,717 |
| Council offices | Replace residual non LED lighting with LED equivalents | 14,011 |
| Council offices | Install an additional 28.8kWp Solar PV | 6,434 |
Leisure Centre Recommendations (emissions from leisure centres not included within CMP report)
| Location | Recommendation | Annual Carbon Saving (kgCO2e) |
|---|---|---|
| Hucknall Leisure Centre | Install 62.4 kWp Solar PV system | 14,319 |
| Lammas Leisure Centre | Install 119.6 kWp Solar PV system | 28,516 |
31 ADC have since contracted NCC Energy Services to undertake a Stage 2 feasibility study of one of these sites (Northern Depot).
32 Carbon savings demonstrated are based on 2019 UK Government GHG conversion factors: Gas kgCO2e 0.18385 Electricity kgCO2e 0.2256
+ 0.0217 (losses). Solar PV figures are adjusted from the solar feasibility proposals to be consistent with other values in the table (inclusion of loss savings).
Based on the preceding analysis, below are high-level short, medium and long term actions to reduce internal emissions for ADC, subject to funding and available resources. Actions related to monitoring and data improvements to enact and fulfil the CMP are included in Section 10.
High level actions to reduce ADC emissions
Fleet use
- Increase the share of ADC’s ULEV fleet, including the share of electric machinery, such as strimmers and lawn mowers.
- Timescale: Medium term
- Conduct a fleet management review and use to improve the efficiency of Council fleet including an in-depth assessment into key fleet use sectors: Waste, Environment and Housing.
- Timescale: Short term
- Investigate further use of telematics to inform behaviour change campaigns.
- Timescale: Short term
Gas and electricity consumption
- Reduce energy consumption, particularly gas, for example through employee behavioural change campaigns and investment in new technologies.
- Timescale: Medium term
- Ensure ADC’s estate is as energy efficient as possible, including through invest to save practices where available (e.g. SALIX finance)
- Timescale: Medium term
- Increase the proportion of renewable energy generation to help decarbonise heating for the ADC estate (e.g. shift away from gas heating sources to heat pumps), and maintain these to ensure operating effectively. Recommendations were included for 6 archetype properties as part of the energy audits.
- Timescale: Medium term
- Install solar PV systems at Hucknall Leisure Centre and Lammas Leisure Centre, as outlined in the NCC Solar feasibility studies
- Timescale: Medium term
- Install solar PV on all viable ADC properties. Preliminary proposals completed by NCC Energy Services and summarised in Section 7 outline some properties where solar may be feasible.
- Timescale: Medium term
- Investigate electricity storage for the ADC estate to allow maximum use of locally generated energy.
- Timescale: Medium term
- Ensure low cost technologies, for example replacing any residual non-LED lighting as suggested in the NCC Energy Services audits, are rolled out across ADC’s estate to reduce energy use.
- Timescale: Medium term
Fugitive emissions
- Consider creating guidance for use of air conditioning systems in ADC buildings and vehicles.
- Timescale: Medium term
Procurement of goods and services, and capital goods
- Assess ADC’s procurement framework to include considerations of travel distances, methods of transport and fuel type to transport goods and services to the Council.
- Timescale: Medium term
- Promote low carbon and sustainable procurement, including the addition of required net zero and sustainability related questions and KPIs. Consider review of Contract Procedure Rules/Sustainability Policy, and implement Procurement Guidance.
- Timescale: Medium term
- Investigate the potential to include technologies to improve water efficiency, such as rainwater harvesting, grey water systems, and water efficient technologies.
- Timescale: Short term
- Improve behaviours to reduce water demand, for example through behavioural change campaigns
- Timescale: Short term
Waste generated in operations
- Reduce the total volume of waste generated where possible through greater reuse, and behavioural change campaigns
- Timescale: Medium term
- Investigate why there has been significant increases in total volume of depot non-household waste, and aim to reduce and reuse where possible.
- Timescale: Medium term
- Investigate the potential to increase water reuse, for example through grey water recovery systems to reduce wastewater
- Timescale: Short term
- Investigate ways to eliminate the remaining waste going to landfill and implement into ADC policy
- Timescale: Long term
Business travel
- Consider ULEV pool cars for business travel use and other carbon reduction options.
- Timescale: Medium term
- Encourage, and assist (where possible) low carbon modes of business travel (e.g. train travel compared to single occupancy car travel).
- Timescale: Medium term
Employee commuting
- Promote car sharing to reduce single occupancy car journeys.
- Timescale: Medium term
- Increase the number of available electric vehicle charging points for council staff and prioritise ULEV car parking spaces.
- Timescale: Short term
- Continue to refine the ‘agile’ agenda to reduce the need to commute (e.g. home/flexi working) and the need to travel for business (e.g. conference calls).
- Timescale: Short term
- Assess ways to promote low/zero carbon methods of transport for staff e.g. increase the number of places for safe cycle storage and assess the available public transport services.
- Timescale: Short term
Investments
- As the largest proportion of ADC’s emissions, consider undertaking a detailed analysis of investment emissions.
- Timescale: Medium term
- Investigate ways to reduce investment emissions (for example sector investing in) and implement into ADC policy.
- Timescale: Long term
Additional Council actions
- Consider establishing Green Champions who actively promote actions towards ADC’s carbon reduction ambitions within their own work and service area.
- Timescale: Short term
- Carry out Carbon Literacy/Awareness Training for ADC employees.
- Timescale: Short term
- Assess alternative investment/income sources for taking climate action e.g. Carbon offset funds and green bonds/investment.
- Timescale: Short term
Area wide actions
- Implement Towns Fund or other funding projects to facilitate improved infrastructure, including encouraging increased walking and cycling, investigating methods of reducing transport emissions within the ADC area, such as increasing the uptake of active travel, reducing the need to travel by car, reviewing the available public transport and improving low carbon transport infrastructure provisions (E.g. EV charging and cycle lanes).
- Timescale: ongoing
- Reduce the amount of waste generated in the area (E.g. Reuse, reduce and recycle), alongside eliminating waste going to landfill, refining the Council’s approach to waste to ensure it meets the Government’s Waste Strategy, and aim to exceed 2023 targets.
- Timescale: ongoing
- Conclude the development of, and implement, the Local Plan, incorporating Climate Change requirements.
- Timescale: ongoing
- Improve the energy efficiency of Council and private buildings (commercial & households), reduce energy demand and increase the uptake of low carbon or renewable heating sources; including bidding for relevant funding to facilitate.
- Timescale: ongoing
- Conclude the completion of the Environmental Charter.
- Timescale: ongoing
- Encourage and assist (where possible) increase of local, affordable and accessible low carbon and renewable energy generation across the ADC area.
- Timescale: ongoing
- Investigate methods of removing carbon from the atmosphere, such as tree planting and woodland management.
- Timescale: ongoing
- Investigate potential actions to ensure resilience to future climate change impacts (e.g. floods and heatwaves).
- Timescale: ongoing
- Investigate ways to improve biodiversity across the area, such as creating a bee friendly district, improving habitat networks, increasing woodland cover and eco-friendly agricultural practices.
- Timescale: ongoing
Further to this report, Ashfield District Council will look to set its carbon management plan targets. This might include setting an interim target year towards carbon neutrality, and addition targets for each emissions category.
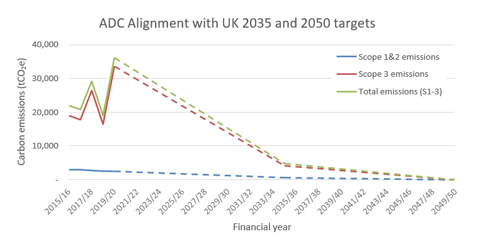
In June 2019, the UK government set the UK a target to reduce net greenhouse gases by 100%, relative to 1990 levels by 2050. In April 2021, this was updated to set an interim 78% reduction target by 2035.
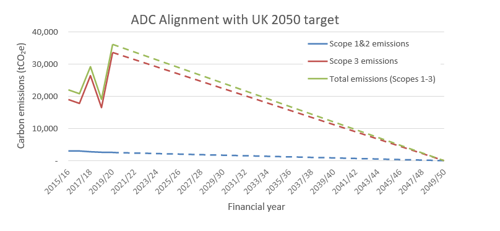
Ashfield District Council’s emissions baseline is 2015/2016, and on this page are 2 example graphs indicating the emissions reductions required if adopting these national targets for ADC emissions. These assume equal rates of reduction for all emission categories, though greater emissions reductions in one area may facilitate a slower reduction in other categories (Appendix 6 Target setting tool). Although the focus should be on reducing emissions from their source, where possible, some emissions may require carbon offsetting to reach carbon neutral.
High level short, medium and long term actions to reduce emissions are covered in Section 8, and recommendations for suitable metrics and monitoring are covered in Section 10.
It is recommended that once the Carbon Management Plan is enacted, regular monitoring occurs, including an annual calculation of internal emissions to track progress against the 2015/2016 baseline.
This would be aided by the development of Key Performance Indicators (KPIs), for example normalised metrics against FTE, turnover or m2, to continue to track emissions consistently despite changes that may be occurring to the ADC organisation or estate. These should be reported as appropriate through ADC’s governance structure.
Further data recommendations for monitoring of specific emissions categories are included below. These will help ensure ADC are able to track any changes in emissions. Priority should be given to those which help monitor the largest proportion of emissions, as these will provide the greatest insight. The energy analysis report33 completed by NCC Energy Services for ADC analysed energy consumption across the highest consuming sites in the ADC estate, identifying actions related to each to investigate trends in energy consumption and to resolve data issues. Some general monitoring recommendations from this are also included in the table below. Improving energy consumption monitoring can help proactively identify anomalies, reduce over-consumption, and therefore emissions.
As with the overall carbon footprint, emissions metrics should be developed where relevant for each of these categories of emissions to help track trends over time. Some suggestions are included in the table below, subject to funding and available resources.
Data and metric recommendations
Targets
Review and implement interim and end-year CMP targets to reach carbon neutrality for ADC
- Priority: High
Fleet
Consider emissions per total number of fleet vehicles as an ADC CMP KPI
- Priority: High
Gas and electricity consumption (including downstream leased assets)
For future energy management and control of utility budgets it is recommended that a similar analysis approach is used as throughout the Energy Analysis Report as part of a regular energy monitoring program using the latest available data (typically on a weekly or monthly basis) to supplement the existing monitoring software, either covering the whole ADC estate or a subset of the highest consuming sites as identified in the Energy Analysis Report. This would assist with identifying changes in consumption and trends, potentially reducing overspend, energy consumption and carbon emissions, and improving knowledge of the estate.
- Priority: High
It is recommended that half-hourly gas and electricity consumption data is obtained for a greater number of sites in the ADC estate. This allows for more accurate and responsive monitoring as well as allowing checks of the daily consumption patterns that may highlight further opportunities for energy and carbon savings. This would require the installation of smart meters/automated meter readings (AMRs) and discussions with the energy supplier to obtain the data on a regular basis.
- Priority: High
As discussed in Section 4 of the Energy Analysis Report, the accuracy of the energy monitoring would be improved if more regular data for on-site renewables or generation can be obtained – preferably at the same frequency as the metered gas/electricity data for the site. This is particularly important for the biomass boilers and solar PV arrays where only quarterly data is currently available.
- Priority: High
Consider emissions per m2 as an ADC CMP KPI
- Priority: High
Consider undertaking an employee working from home survey to capture data related to net increases in an employee’s energy use whilst working from home during 2020-2134.
- Priority: High
Fugitive emissions
Investigate and improve data for fleet air conditioning units and fridges (e.g. refrigerant type, charge).
- Priority: Low
Procurement of goods and services
Increase and improve supplier-specific data for purchased goods and services (e.g. quantity or mass of units purchased), with specific data on upstream transport (e.g. vehicle & fuel type, distance travelled, number of products per order) and distribution (e.g. storage in warehouses and distribution facilities).
- Priority: High
Investigate the emissions that arise from the storage of goods coming into ADC in warehouses, distribution and retail facilities.
- Priority: High
Consider purchased goods and services emissions per procurement spend as an ADC CMP KPI
- Priority: Medium
Consider upstream transportation and distribution emissions per order as an ADC CMP KPI
- Priority: Medium
Capital goods
Total cradle-to-gate emissions of purchased capital goods are all included in the year of acquisition. Major capital purchases in one year can therefore mean emissions from capital goods fluctuate significantly between years. It is suggested that a CO2e/£ spent on capital goods is used as an ADC CMP KPI.
- Priority: Medium
Business travel
Consider business travel emissions per journey as an ADC CMP KPI. This may require further data for example the number of business mileage claims and train tickets booked.
- Priority: Medium
Employee commuting
Conduct (bi)annual employee commuting surveys for a high proportion (>60%) of ADC employees, including fuel type, distance travelled and number of days commuting per week.
- Priority: Medium
Investments
Consider investment emissions per investment value as an ADC CMP KPI
- Priority: Medium
As the largest proportion of ADC’s emissions, consider undertaking a detailed analysis of investment emissions.
- Priority: Medium
If applicable to ADC, source data for the remaining categories of investments as defined in the GHG Protocol to provide a fuller estimate of the emissions from investments (equity investment & debt investment without known use of proceeds; project finance & debt investment with known use of proceeds; project finance where initial sponsor/lender).
- Priority: Medium
33 For further details please see ADC_EnergyConsumptionAnalysis.pdf
34 Following an operational boundary, energy use as a result of employees working from home would be included in ADC’s emissions footprint.
While Nottingham City Council strives to convey accurate information in good faith, neither Nottingham City Council nor any of its staff, can accept any responsibility for the information supplied in this document, nor its interpretation. Neither can they accept any responsibility for the actions of, or any information supplied by, any third parties referred to herein. The content of this document does not constitute legal advice.
With the sole exception of Ashfield District Council the information contained in this report should not be relied upon or reproduced without the written permission of Nottingham City Council. All information collected and reported will be treated as confidential and stored in accordance with the Data Protection Act.
Scope 1 (tCO2e)
| Scope 1 (tCO2e) | 2015 - 2016 | 2016 - 2017 | 2017 - 2018 | 2018 - 2019 | 2019 - 2020 | Exclusions / justifications where relevant |
|---|---|---|---|---|---|---|
| Gas | 879.12 | 951.28 | 880.48 | 945.95 | 979.53 |
|
| Biomass | 4.01 | 11.77 | 12.28 | 8.33 | 8.78 |
CH4 and N2O only; CO2 emissions from biomass combustion are reported outside of scopes. |
| Fleet | 1073.4 | 1125.8 | 113.9 | 1,066.3 | 1032.7 |
|
| Fugitive emissions | 3.84 | 3.84 | 3.84 | 3.84 | 3.84 |
|
| Scope 1 Total | 1960.3 | 2092.7 | 2010.5 | 2024.4 | 2024.9 |
Scope 2 (tCO2e)
| Scope 2 (tCO2e) | 2015 - 2016 | 2016 - 2017 | 2017 - 2018 | 2018 - 2019 | 2019 - 2020 | Exclusions / justifications where relevant |
|---|---|---|---|---|---|---|
| Electricity Location-based approach | 1033.53 | 961.71 | 789.91 | 614.13 | 561.59 | |
| Scope 2 Total (Location-based approach) | 1033.5 | 961.7 | 789.9 | 614.1 | 561.6 |
Scope 3 (tCO2e)
| Scope 3 (tCO2e) | 2015 - 2016 | 2016 - 2017 | 2017 - 2018 | 2018 - 2019 | 2019 - 2020 | Exclusions/justifications where relevant |
|---|---|---|---|---|---|---|
| Purchased goods and services | 5844.86 | 5200.16 | 4804.81 | 4126.83 | 4004.17 | Includes procurement (spend based data) and water supply (m3). |
| Capital goods | 5851.14 | 4327.23 | 4651.96 | 2632.96 | 4143.22 | |
| Fuel- and energy-related activities |
621.25 |
651.31 |
650.81 |
565.07 |
539.38 |
|
| Upstream transportation and distribution | 998.84 | 1000.24 | 877.85 | 964.03 | 1026.72 | Does not include data for storage of goods in warehouses |
| Waste generated in operations | 37.71 | 42.79 | 47.22 | 52.14 | 50.25 |
|
| Business travel | 92.99 | 91.34 | 83.28 | 80.55 | 71.65 |
|
| Employee commuting | 1106.22 | 1114.45 | 1047.57 | 995.02 | 935.71 | |
| Upstream leased assets |
|
|
|
|
|
|
| Downstream transportation and distribution |
|
|
|
|
|
|
| Processing of sold products |
|
|
|
|
|
|
| Use of sold products |
|
|
|
|
|
|
| End-of-life treatment of sold products |
|
|
|
|
|
|
| Downstream leased assets | 227.98 | 183.86 | 137.37 | 174.44 | 130.89 | Includes solar consumption at grid intensity (location-based approach) |
| Franchises |
|
|
|
|
|
|
| Investments | 4224.94 | 5212.81 | 14,147.57 | 6899.86 | 22,730.47 | |
| Scope 3 Total | 19,005.9 | 17,824.2 | 26,448.4 | 16,490.9 | 33,632.5 |
Tonnes CO2e
| Tonnes CO2e | 2015 - 2016 | 2016 - 2017 | 2017 - 2018 | 2018 - 2019 | 2019 - 2020 |
|---|---|---|---|---|---|
| Gross emissions (using Scope 2 location-based approach) | 22,000 | 20,879 | 29,249 | 19,129 | 36,219 |
| Exported renewable electricity production |
- |
- |
0.6 | 0.9 | 0.7 |
| Renewable electricity generated from owned or controlled sources | 23.6 | 61.2 | 57.6 | 61.8 | 55.8 |
| Renewable energy-related activities | 5.8 | 16.7 | 18.5 | 24.6 | 24.6 |
| Renewable electricity generated from downstream leased assets | 1.9 | 2.0 | 1.7 | 1.7 | 1.3 |
| Offsets |
|
|
|
|
|
|
Woodland Carbon units |
|
|
|
|
|
| Net emissions | 21,969 | 20,799 | 29,170 | 19,041 | 36,136 |
Emissions outside of scopes 1-3
| Biomass (tCO2) | 2015 - 2016 | 2016 - 2017 | 2017 - 2018 | 2018 - 2019 | 2019 - 2020 |
|---|---|---|---|---|---|
| Biomass (tCO2) | 106.76 | 314.69 | 337.77 | 193.21 | 196.25 |
Within the report, the net emissions per category are analysed. These take the total gross emissions as presented in Appendix 1, minus emissions reductions from renewable consumption. The emissions however are slightly greater than the ‘Net emissions’ as shown in Appendix 1, as exported renewable electricity production has not been taken off the emissions for any one category; these emissions are taken off the overall gross footprint to give the true net emissions.
tCO2e
| Scope | Type | 2015 - 2016 | 2016 - 2017 | 2017 - 2018 | 2018 - 2019 | 2019 - 2020 |
|---|---|---|---|---|---|---|
| Scope 1 | Gas | 879.12 | 951.28 | 880.48 | 945.95 | 979.53 |
| Scope 1 | Biomass | 4.01 | 11.77 | 12.28 | 8.33 | 8.78 |
| Scope 1 | Fleet | 1073.35 | 1125.80 | 1113.88 | 1066.32 | 1032.74 |
| Scope 1 | Fugitive emissions | 3.84 | 3.84 | 3.84 | 3.84 | 3.84 |
| Scope 2 | Electricity (net, location-based approach) | 1009.95 | 900.49 | 732.28 | 552.37 | 505.77 |
| Scope 3 | Purchased goods and services | 5844.86 | 5200.16 | 4804.81 | 4126.83 | 4004.17 |
| Scope 3 | Capital goods | 5851.14 | 4327.23 | 4651.96 | 2632.96 | 4143.22 |
| Scope 3 | Fuel- and energy-related activities (net) | 615.50 | 634.56 | 632.33 | 540.47 | 514.76 |
| Scope 3 | Upstream transportation and distribution | 998.84 | 1000.24 | 877.85 | 964.03 | 1026.72 |
| Scope 3 | Waste generated in operations | 37.71 | 42.79 | 47.22 | 52.14 | 50.25 |
| Scope 3 | Business travel | 92.99 | 91.34 | 83.28 | 80.55 | 71.65 |
| Scope 3 | Employee commuting | 1106.22 | 1114.45 | 1047.57 | 995.02 | 935.71 |
| Scope 3 | Downstream leased assets (net) | 226.06 | 181.81 | 135.70 | 172.79 | 129.59 |
| Scope 3 | Investments | 4224.94 | 5212.81 | 14,147.57 | 6899.86 | 22,730.47 |
| Totals | Total emissions (in CMP report analysis) | 21,968.5 | 20,798.6 | 29,171.0 | 19,041.4 | 36,137.2 |
This outlines how these sources of Scope 1 and 2 emissions have been applied in calculating Ashfield District Council’s carbon footprint.
Scope 1 and 2 Emissions source - Gas and electricity consumption
Methodology and assumptions (where relevant)
- Emissions calculated using monthly consumption data
Calculation assumptions:
- Took out leased assets, except where data included for void periods. Part leased assets remain included in the dataset, as unable to split what proportion is under operational control or not.
Data backfilling:
- Average per month calculated for data which is available for each site up to March 2020. This monthly average is used to infill missing data where backfilling is required, as indicated by ADC by the key on the provided spreadsheet.
- Credits/reimbursement are included in yearly totals, so that overall totals for year are accurate.
Data sources
- ADC spreadsheet - Energy consumption – For NCC 02.02.21 - Gas and electricity consumption per month
- ADC spreadsheet 1) Combined summary v2 01.02.20 - SPV installations
Emissions factor data sources
- BEIS conversion factors: advanced set; 2015 to 2019 figures
Scope 1 and 2 Emissions source - Biomass consumption
Methodology and assumptions (where relevant)
- Emissions calculated using biomass fuel delivery amounts (wood pellets).
Calculation assumptions:
- Emissions are included for the financial year in which the wood pellets delivery date was during.
Data sources
- ADC energy consumption and renewables info Biomass – Titchfield Court, Biomass – Sherwood Court
Emissions factor data sources
- BEIS conversion factors: advanced set; 2015 to 2019 figures
Scope 1 and 2 Emissions source - Fleet
Methodology and assumptions (where relevant)
- Emissions calculated using litres of fuel consumed.
Calculation assumptions:
- Diesel and Petrol average biofuel blend emissions factors used
- Red Diesel does not hold its own conversion factor and therefore given the same factor as normal diesel
- AdBlue discounted in fuel use due to insufficient emissions intensity factors for AdBlue and specific vehicle types. This should be investigated further
- Vehicles of low frequency or unidentified have been identified as miscellaneous.
Data sources
3a) Non-Housing 5 year fuel report - Fleet fuel consumption per month per vehicle
3b) Housing 5 year fuel report - Fleet fuel consumption per month per vehicle
Emissions factor data sources
- BEIS conversion factors: advanced set; 2015 to 2019 figures
Scope 1 and 2 Emissions source - Fugitive emissions
Methodology and assumptions (where relevant)
- Screening method used to calculate fugitive emissions.
Calculation assumptions:
- As with gas and electricity consumption, air conditioning and refrigeration units in part leased assets remain included in the dataset, as unable to split what proportion of these assets are under operational control or not
- Some units have R22 as a refrigerant. R22 is not included as a greenhouse gas under the Montreal and Kyoto Protocols, and is therefore not covered within the GHG Protocol. As such, this is not included in ADC’s calculated footprint
- Assumed the refrigerant type in fridges is R410A. This has one of the lowest global warming potentials (GWP), and may therefore be an underestimate of these emissions. R410A is also considered a greenhouse gas, though there is the potential that the refrigerant is not covered within the Kyoto Protocol, and therefore would not be included in the emissions inventory
- Charge (for fridges) and annual leakage rate per type of unit (fridge, air conditioning) use the average of the range given in the IPCC Good Practice Guidelines and Uncertainty Management in National Greenhouse Inventories (2000). These have a wide range, and the value used can result in highly variable outcome, hence the average is used consistently for each year in this report
- Assumed the refrigerant type in fleet air conditioning units is R134a, with an average charge of 1kg. Assumed charge has been based on internet sources, as no range is given for average charge in the IPCC Good Practice Guidelines and Uncertainty Management in National Greenhouse Inventories (2000)
- As indicated by ADC, assumed no change in last 5 years in number and type of air conditioning units in buildings, fleet air conditioning units, or numbers and size of fridges.
Data sources
- Air Con List for NCC
- Air conditioning units on buildings, number and size of fridges, number of fleet air conditioning units (20/21)
Emissions factor data sources
- GWP from Table 1 in the GHG Protocol Fugitive emissions calculator tool (GWPs from IPCC Second Assessment Report (1995) and ASHRAE Standard 34).
Previous section:
Next section:
This information outlines how the GHG Protocol Scope 3 categories have been applied in calculating Ashfield District Council’s carbon footprint.
GHG Protocol Scope 3 categories
Scope 3 Category: Purchased goods and services
Applicability to Ashfield District Council
Yes
Methodology and assumptions
(where relevant)
Spend-based calculation method used for purchased goods and services, with water supply calculated from monthly water meter data. Spend deflated to 2011 equivalent values to be consistent with emission factors. Deflation rates taken from Government’s National Statistics – GDP Deflators at market prices, and money GDP. Calculation Assumptions: Spend data:
- Changed analysis code D103 from SIC Code 17; 18 to 17 only. This has the higher emissions factor (1.18 kgCO2e/£ vs 0.58 kgCO2e).
Water consumption data:
- Took out leased assets, except where data included for void periods. Part leased assets remain included in the dataset, as unable to split what proportion is under operational control or not. This is consistent with gas and electricity consumption with these sites also included in Scope 1 and 2 emissions, rather than split between Scopes 1 and 2, and Scope 3.
- Data backfilling: Average per month calculated for data which is available for each site up to March 2020. This monthly average is used to infill missing data where backfilling is required, as indicated by ADC by the key on the provided spreadsheet.
- Credits/reimbursement are included in yearly totals, so that overall totals for year are accurate.
Data sources
- ADC spreadsheet 1) Combined Summary v2 01.02.20, worksheet 1. Purchased Goods and Services Spend per SIC Code per financial year
- ADC spreadsheet Energy Consumption – For NCC 02.02.21 Water consumption per month
Emissions factor data sources
UK Government ‘Table 13 – Indirect emissions from the supply chain’,
2011 figures.
BEIS Conversion factors: advanced set; 2015 to 2019 figures
Scope 3 Category: Capital goods
Applicability to Ashfield District Council
Yes
Methodology and assumptions
(where relevant)
Spend-based calculation method used for capital goods. Spend deflated to 2011 equivalent values to be consistent with emission factors. Deflation rates taken from Government’s National Statistics – GDP Deflators at market prices, and money GDP.
Data sources
- ADC spreadsheet 1) Combined Summary v2 01.02.20, worksheet 2. Capital goods Spend per SIC Code and type of capital spend per financial year
Emissions factor data sources
UK Government ‘Table 13 – Indirect emissions from the supply chain’, 2011 figures.
Scope 3 Category: Fuel and energy related activities
Applicability to ADC
Yes
Methodology and assumptions
(where relevant)
Average data method used to calculate upstream emissions of purchased fuels, upstream emissions of grid electricity, and transmission and distribution losses of grid electricity. Assumptions during calculation are the same as for each of the individual sources covered in the Scope 1 and 2 methodology table (excluding fugitive emissions which are not included in Scope 3 category 3).
Data sources
- ADC spreadsheet Energy Consumption – For NCC 02.02.21 Gas and electricity consumption per month
- 3a) Non-Housing 5 Year Fuel Report Fleet use per month
- 3b) Housing 5 Year Fuel Report Fleet use per month
- ADC spreadsheet 1) Combined Summary v2 01.02.20 (SPV Installations)
- ADC Energy Consumption and Renewables Info Biomass – Titchfield Court, Biomass – Sherwood Court)
Emissions factor data sources
BEIS Conversion factors: advanced set; 2015 to 2019 figures
Scope 3 Category: Upstream transportation and distribution
Applicability to Ashfield District Council
Yes
Methodology and assumptions
(where relevant)
Emissions for upstream transportation only are provided. These have a large number of assumptions, and should be treated as an indicative figure only. It has been assumed that all UK-derived products have been transported by an average-laden HGV; and all imported products by freight short haul flight. The distance between the supplier’s postcode and ADC has been used to calculate the distance of travel. Emissions in this category do not include storage in warehouses, distribution & retail facilities. Including this data would provide a fuller picture of emissions.
- Average of figures for 2019/20, 2018/19 and 2017/18 used to calculate data for 2016/17 and 2015/16.
- Postcodes that did not compute a distance were discounted from the analysis.
Data sources
- Revised postcodes on Upstream data 23.03.21 Number of transactions per supplier postcode per financial year 2017/18 to 2019/20
Emissions factor data sources
BEIS Conversion factors: advanced set; 2015 to 2019 figures
Scope 3 Category: Waste generated in operations
Applicability to Ashfield District Council
Yes
Methodology and assumptions
(where relevant)
Emissions are calculated using the waste-type-specific method. This includes calculations for each waste type and the specific waste treatment method. Wastewater data is from water consumption data, however water supply to allotments is excluded from wastewater calculations.
Calculation assumptions:
Housing maintenance:
- Weight of waste is included in the financial year in which the skip was delivered (rather than collected).
- Waste data was only provided for 2019-20. It has been assumed the same proportions and weight of waste were generated each of the prior 4 years. This has not been scaled by FTE or number of properties at Ashfield District Council.
- The end destination of each waste type has been assumed, and assumptions run past the waste team at Ashfield District Council.
Depot – non-housing:
- The waste from silt traps, and petrol/oil interceptors has been converted from tonnes of waste to volume of waste. In doing so, it has been assumed that the average composition of the waste is predominantly water. This results in a larger volume than might be the case, and thus would be an overestimate of emissions from this part of the waste. These wastes go to a physio-chemical treatment plant, and are therefore treated as wastewater in the carbon emission calculations, however are included within the ‘Depot – non-housing’ waste category.
Confidential waste:
- Confidential waste is assumed to all be paper, unless specifically described otherwise. For example, it has been assumed all elections and clearance confidential waste is paper.
Waste liquids:
- Within the Greenhouse Gas Protocol Scope 3 Standard, waste generated in operations includes solid waste and wastewater only. However, the waste liquid volumes provided have been included within the calculations for Ashfield District Council’s footprint.
- Based on information from Ashfield District Council, those waste liquids which are hazardous (determined by EWC code) are assumed to have been incinerated. Non-hazardous waste liquids are assumed to have been recycled. In the absence of other appropriate emissions factors to use, ‘commercial and industrial waste’ has been used to provide an estimate of what these emissions may be.
- Data was provided for 2018/19 and 2019/20, and an average of these weights were used for the three preceding years.
- The assumptions for wastewater are the same as those outlined for water supply in Category 1: Purchased Goods and Services.
Landfill emissions factor methodology note:
- The UK government’s conversion factors occasionally have methodological updates. This is separate to updating the factors annually each year to reflect the most recent data.
- In 2016, the emissions landfill factors were updated to reflect a more recent source of data in the BEIS’ published conversion factors. The estimate for methane capture from landfill waste increased by 61% as a result of this change, which affects all landfill emissions for most organic materials.
- In 2017, the emissions landfill factors were again updated, with emissions from landfill taken directly from DEFRA’s landfill emissions calculation model for methane emissions from landfill, with the addition of collection and transport emissions35. The methodology for 2017 onwards is completely different to that for 2015 and 2016, and is not comparable.
- This only affects the waste emissions reported for asbestos and inert waste from housing maintenance, as the only sources of waste assumed to go to landfill.
Waste end destination assumptions:
Waste type to end destination assumption.
To landfill
- Asbestos
- Inert
To be recycled
- Confidential waste (media / ink cartridges)
- Confidential waste (paper)
- Glass
- Plasterboard
- Recycling
- Scrap metal
- Waste liquids (non-hazardhous)
To be incinerated
- General waste
- Green waste
- Mixed timber
- Non-hazardous WEEE
- Waste liquids (hazardous)
To be disposed of at a Physio- Chemical Treatment Plant
- Silt trap & petrol/oil interceptor
Data sources
- 5a) Waste Data 5 years n- Housing Maintenance 2019 - 2020
- 5b) Waste Data 5 years - Depot – non - housing
- 5c) Confidential Waste 5 years
- 5d) Waste liquids etc. January 2018 - October 020
- ADC spreadsheet Energy Consumption - For NCC 02.02.21 Water consumption per month
Emissions factor data sources
BEIS Conversion factors: advanced set; 2015 to 2019 figures
Scope 3 Category: Business travel
Applicability to Ashfield District Council
Yes
Methodology and assumptions
(where relevant)
Combination of distance based method for business miles claimed, and spend-based method for rail fares and hotel stays expenditure.
Emissions from business travellers’ hotel stays are calculated by number of nights stayed in hotels in each country.
Calculation assumptions:
- Assumed car business mileage claimed has the same proportion of car type as employees answered in ADC’s 2020 employee commuting survey.
-
Small (<1.4l), medium (1.4l - 2.0l) and large car (>2l) defined using BEIS Conversion Factor Methodology.
-
Converted rail expenditure to distance travelled using Office of Rail and Road (ORR) Table 1210 – Revenue per passenger kilometres and per passenger journey
-
Estimated average cost per night for a hotel near Nottingham from Hotels.com
Data sources
- ADC spreadsheet 1) Combined Summary v2 01.02.20, worksheet 6 Business mileage, 6&7 Business Travel, 1. Purchased Goods and Services (hotels)
Emissions factor data sources
BEIS Conversion factors: advanced set; 2015 to 2019 figures
Scope 3 Category: Employee commuting
Applicability to Ashfield District Council
Yes
Methodology and assumptions
(where relevant)
Emissions calculated using number of employees, the number of days employees used to travel to work (pre-COVID-19), the average commuting time and mode of transport from ADC’s 2020 Employee Commuting Survey.
Calculation assumptions:
- Survey results have been scaled up based on the proportion of survey respondents and total employees.
- Small (<1.4l), medium (1.4l - 2.0l) and large car (>2l) defined using BEIS Conversion Factor Methodology.
- Total average commuting distance and time, alongside percentage share of method of transport used to determine the distance per year travelled per mode of transport by survey respondents.
Data sources
- ADC spreadsheet 1) Combined Summary v2 01.02.20, worksheet 6&7 commuting
Emissions factor data sources
BEIS Conversion factors: advanced set; 2015 to 2019 figures
Scope 3 Category: Upstream leased assets
Applicability to Ashfield District Council
No (Assigned to scope 1 and 2 emissions)
Methodology and assumptions
(where relevant)
Reported within scope 1 and 2 emissions
Data sources
N/A
Emissions factor data sources
N/A
Scope 3 Category: Downstream transportation and distribution
Applicability to Ashfield District Council
No
Methodology and assumptions
(where relevant)
ADC do not manufacture products to a significant scale, that are then sold downstream to customers and therefore emissions are not reported for this category.
Data sources
N/A
Emissions Factor Data Sources
N/A
Scope 3 Category: Processing of sold products
Applicability to ADC
No
Methodology and Assumptions
(where relevant)
ADC do not manufacture products to a significant scale, that are then sold downstream to customers and therefore emissions are not reported for this category.
Data sources
N/A
Emissions factor data sources
N/A
Scope 3 Category: Use of sold products
Applicability to Ashfield District Council
No
Methodology and assumptions
(where relevant)
ADC do not manufacture products to a significant scale, that are
then sold downstream to customers and therefore emissions are not reported for this category.
Data sources
N/A
Emissions factor data sources
N/A
Scope 3 Category: End of life treatment of sold products
Applicability to Ashfield District Council
No
Methodology and assumptions
(where relevant)
ADC do not manufacture products to a significant scale, that are then sold downstream to customers and therefore emissions are not reported for this category.
Data sources
N/A
Emissions factor data sources
N/A
Scope 3 Category: Downstream leased assets
Applicability to Ashfield District Council
Yes
Methodology and assumptions
(where relevant)
Downstream leased assets have been calculated from monthly gas and electricity consumption.
Calculation assumptions:
- Leased assets included, except where data included for void periods
- Data excludes assets marked as leased but with data for void periods only. These assets are included in Scope 1 and 2 emissions.
- Data excludes part leased assets, as unable to split what proportion is under operational control or not. These part leased assets are included in Scope 1 and 2 emissions.
Data backfilling:
- Average per month calculated for data which is available for each site up to March 2020. This monthly average is used to infill missing data where backfilling is required, as indicated by ADC by the key on the provided spreadsheet.
- Credits/reimbursement are included in yearly totals, so that overall totals for year are accurate.
Data sources
- ADC spreadsheet Energy Consumption – For NCC 02.02.21 Monthly gas and electricity consumption
- ADC spreadsheet 1) Combined Summary v2 01.02.20 (SPV Installations)
Emissions factor data sources
BEIS Conversion factors: advanced set; 2015 to 2019 figures
Scope 3 Category: Franchises
Applicability to Ashfield District Council
No
Methodology and assumptions
(where relevant)
There are no franchises to ADC and therefore there are no emissions to report within this category
Data sources
N/A
Emissions factor data sources
N/A
Scope 3 Category: Investments
Applicability to Ashfield District Council
Yes
Methodology and assumptions
(where relevant)
Average investment balance per financial year used to provide a high level estimate of emissions from investments.
Calculation Assumptions:
- Used average GBP to USD conversion rate (average per month averaged over financial year).
Rates from:
- website: Yearly average rates - OFX
Data sources
- ADC spreadsheet 1) Combined Summary v2 01.02.20 (15 Investments categories, 15a Treasury Investments)
Emissions factor data sources
Conversion factors are from Quantis Scope 3 Evaluator tool, which is based on the GHG Protocol.
These use:
- website: World Input-Output Database (WIOD).
Factors use the most recent available (2009) for a high level estimate.
In the GHG Protocol, water emissions are split between water supply (in Scope 3 category 1) and water treatment (in Scope 3 category 5).
Combining the emissions from water supply and treatment, total water emissions accounted for 0.063% of total Scope 3 emissions in 2019 / 2020 and 0.058 percent of Ashfield District Council’s overall Scope 1-3 footprint.
In 2019 / 2020, emissions from supply of water (8.96 tCO2e) account for 0.2 percent of emissions from purchased goods and services in 2019 / 2020. Emissions from water treatment (12.06 tCO2e) account for 24.0 percent of emissions from waste generated in operations.
Graph - ADC Total Water Emissions
Since 2015 / 2016, four ADC site groups have accounted for over 85 percent of all water emissions: Council Offices, Communal Courts, Allotments and Leisure36. These 4 site groups should be a focus for actions to reduce water consumption and waste water37. In 2019 / 2020, the greatest proportions of water use come from Council Offices (39.3 percent), followed by Communal Courts (16.5 percent), Allotments (14.8 percent) and Leisure (14.2 percent).
In this graph, historic billing and water leak issues may account for the large increase in water emissions from Council Offices in 2017 / 2018, and the drop in emissions from Leisure sites in 2019 / 2020.38
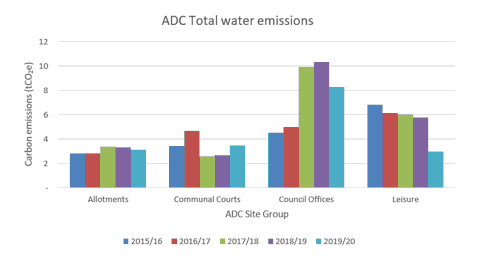
36 Does not include Leisure Centres as outside of ADC’s operational control
37 It is assumed that there is no waste water from allotments requiring treatment
38 Historic billing and water leak issues at Northern Depot (Council Offices site group); historic billing issues at Sutton Lawn Park (Leisure site group).
An example tool which can be used to aid target setting for ADC’s emissions is available upon request.
Contact details
- Contact us
- info@ashfield.gov.uk
- 01623 450000
-
Ashfield District Council
Council Offices
Urban Road
Kirkby in Ashfield
Nottinghamshire
NG17 8DA
Page last updated 23 October 2025