5. Scope 3 Emissions
Category 1: Purchased Goods and Services
Emissions from purchased goods and services accounted for 11.9% of total Scope 3 emissions in 2019/20 and 11.1% of Ashfield District Council’s overall Scope 1-3 footprint. Since 2015/16, emissions from purchased goods and services have decreased by 32%.
Spend data has been categorised by SIC code19, and covers 37 of these. Emissions from 23 of the SIC code categories have less than 1% share of total emissions each year, and sum to between 4.6-5.8% each year; these have been grouped as ‘Other’ in the graph below.
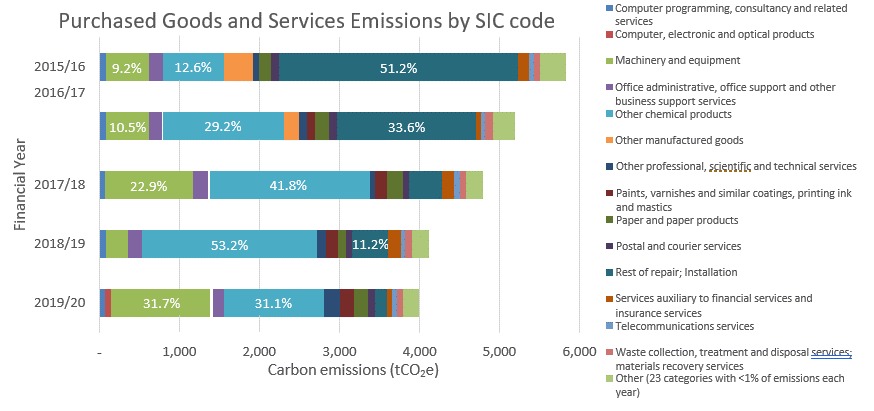
In 2015/16, over half of emissions (51.2%) were from repair and installation (2990.7tCO2e).
In 2016/17, repair and installation similarly accounted for a large proportion of emissions (33.6%), as well as other chemical products (29.2%).
In 2017/18, repair and installation no longer contributes the most emissions, rather Other chemical products (41.8%) and machinery and equipment (22.9%).
In 2018/19, over half of emissions were from purchase of Other chemical products (53.2%).
In 2019/20, the greatest emissions contributions were again split between Other chemical products (31.1%) and machinery and equipment (31.7%).
Data in this category is calculated from spend data for purchased goods and services, and water meter data for water supply20. The calculation of emissions related to water supply is considered robust, however there are large limitations in the spend data used for calculating emissions from the remaining goods and services. Going forwards, acquiring more supplier-specific data (e.g. quantity or mass of units purchased) will enable improvements in this area to be calculated and reported more accurately.
Category 2: Capital Goods
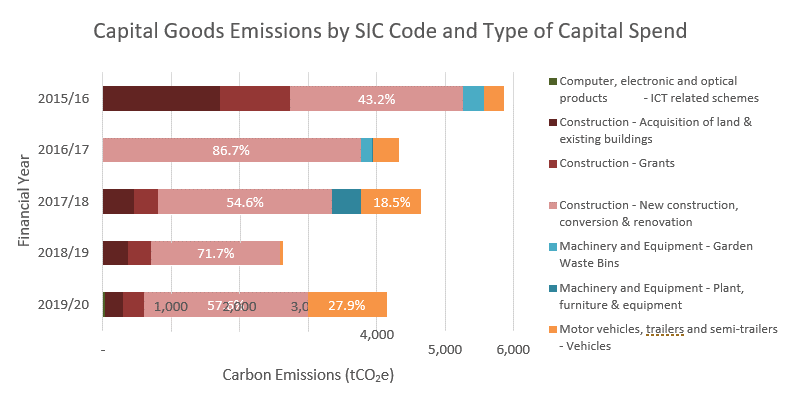
Emissions from capital goods accounted for 12.3% of total Scope 3 emissions in 2019/20 and 11.5% of Ashfield District Council’s overall Scope 1-3 footprint.
Total cradle-to-gate21 emissions of purchased capital goods are all included in the year of acquisition. Major capital purchases in one year can therefore mean emissions from capital goods fluctuate significantly between years. 2018/19 has much lower emissions from capital goods than other years, this reflects the much lower spend on capital goods in this financial year. Despite this, emissions from purchased capital goods have decreased by 29.2% from 2015/16 to 2019/20.
Spend data has been categorised by type of capital spend, which cover 4 SIC codes: Construction; Motor vehicles, trailers and semi-trailers; Machinery and Equipment; and Computer, electronic and optical products.
In all years, over 70% of emissions are from purchase of capital goods related to construction. The largest proportion of these emissions is from capital spend related to new construction, conversion and renovation, accounting for over 70% of these emissions in all years since 2016/17. In 2015/16, 48% of emissions from capital goods related to construction, were from new construction, conversion and renovation.
In 2019/20, after emissions from purchase of capital goods related to construction, emissions from purchase of capital goods related to motor vehicles, trailers and semi-trailers vehicles account for the next largest proportion of emissions (27.9%).
In 2017/18, 9.6% of capital goods emissions was from plant, furniture and equipment, reflecting the greater spend on this type of capital than in other years. This included spend on a glass recycling project (70.2%) and vehicle tracking system (14.9%).
Category 3: Fuel- and Energy-Related Activities
Emissions from fuel and energy-related activities accounted for 1.5% of total Scope 3 emissions in 2019/20 and 1.4% of Ashfield District Council’s overall Scope 1-3 footprint.
These emissions are related to the production of energy, and for electricity, the transmission and distribution losses for purchased energy. Emissions are therefore the result of the gas, electricity, fleet use, and biomass usage, as covered for Scope 1 and 2 emissions22. Emissions for fuel- and energy- related activities have decreased by 16% since 2015/16. The trends in emissions from fuel- and energy- related activities reflect the proportions of emissions and trends highlighted for these categories earlier in the Scope 1 and 2 emissions trend analysis (Section 4).
Category 4: Upstream Transport and Distribution
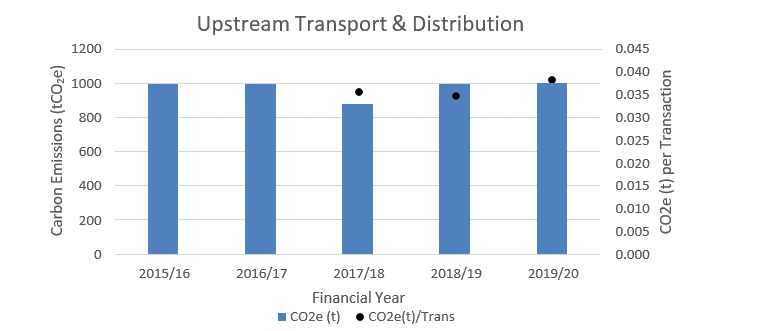
Emissions from upstream transportation of goods accounted for 3.1% of total Scope 3 emissions in 2019/20 (1027 tCO2e) and 2.8% of ADC’s overall Scope 1-3 footprint.
The distance between the supplier postcode and ADC has been used to calculate journey distances, due to limited data available it is assumed that all UK-derived products have been transported by an average laden HGV. ADC do not hold information for 2015/16 and 2016/17 financial years; the data for these years have been estimated based on averages of data for the last three year period.
Upstream transportation and distribution emissions have increased 2.79% than estimated 2015/16 upstream transport and distribution emissions23. Since 2017/18, upstream transportation emissions have increased each year due to greater total distances being travelled. The last three years of data indicate emissions per delivery into ADC are in the region of 0.035 to 0.038 tCO2e.
Improvements to this data could be made through improving supplier specific data, such as the vehicle and fuel type used to deliver goods and the exact distances travelled. In addition, these calculations do not currently include storage in warehouses and distribution/retail facilities. Including this data would provide a fuller picture of emissions, and would likely increase the percentage share of the total Scope 3 emissions.
Category 5: Waste generated in operations
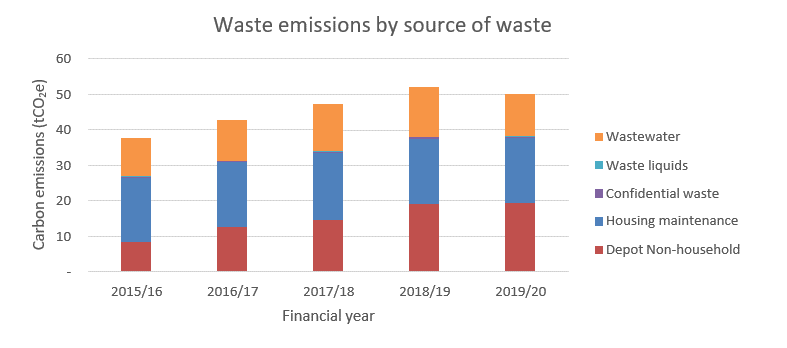
Emissions from waste generated in operations account for 0.1% of total Scope 3 emissions in 2019/20 and 0.1% of Ashfield District Council’s overall Scope 1-3 footprint. Since 2015/16, emissions from waste generated in operations has increased by 33%.
Waste data has been categorised by source of the waste, as split by Ashfield District Council. Waste generated in operations also includes waste water. The quantity of waste water is assumed to be the same as the water supplied to Ashfield District Council, however water supply from allotments is excluded from waste water calculations. Housing maintenance waste, depot non-household waste, and waste water collectively account for 99% of waste emissions. Confidential waste and waste liquids account for the remaining 1% of emissions. The emissions associated with running refuse lorries is included within this emissions footprint for Ashfield District Council (Scope 1 Fleet emissions), however the domestic waste collected is not.
In 2015/16, housing maintenance (48%) and waste water (29%) emissions account for the greatest proportion of emissions, with a much lower proportion from depot non-household (22%).
Emissions from depot non-household waste increases from 8.5 tCO2e in 2015/16 to 19.35 tCO2e in 2019/20. This is an increase of 129%, and results in 2019/20 having the greatest proportion of waste emissions from any category being from depot non-household waste.
This increase in emissions is as a result of the increase in waste tonnage, for both general waste and recycling (157% and 33% increases respectively). The emission factors stay broadly consistent year on year, and have little impact on the overall emissions.
In contrast, the emissions from the other predominant categories of waste (housing maintenance, waste water) stay much more constant year on year. The housing maintenance waste was only available for 2019/20, and has been assumed to be a consistent tonnage for the previous four years. waste water volume has increased by 12% between 2015/16 and 2019/20, however in comparison to other waste streams has a much lower emissions intensity, and as a result this increase in waste has less of an impact on overall waste emissions24.
In considering these emissions, it should be noted that only the end-of-life disposal is taken into account in these waste emissions figures, and these should not be used to determine the relative lifecycle merit of different waste management options. This is in line with the Greenhouse Gas Protocol. For example, the benefits of energy recovery and recycling are attributed to the end user of the recovered energy or recycled goods, rather than the waste producer. As such, when considering waste emissions only, both these end destinations have the same emissions intensity (i.e. 1 tonne of general waste and 1 tonne of recycling will both have same volume of waste emissions).
Category 6: Business Travel
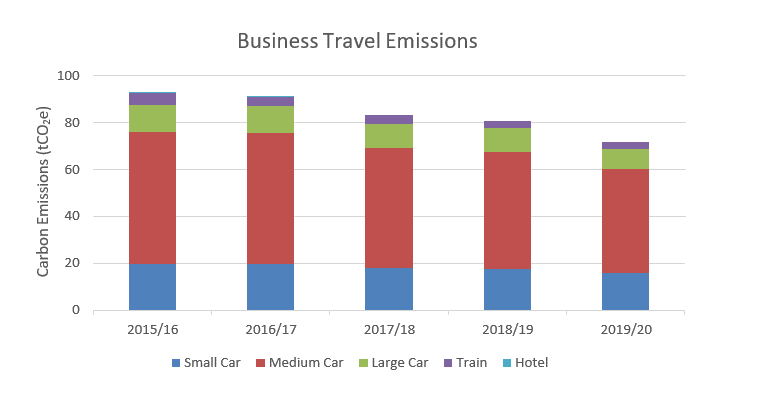
Business travel includes any travel that is required to attend meetings, conferences, training and running of key council services (e.g. home visits), as well as emissions from staying in hotels. Emissions from business travel account for 0.2% of total Scope 3 emissions in 2019/20 and 0.2% of Ashfield District Council’s overall Scope 1-3 footprint.
ADC’s business travel emissions in 2019/20 equated to 71.65 tCO2e. This can be broken down further by the mode of travel, which demonstrates that car journeys dominate the emissions mix, with a 96% share of business travel emissions from 241,271 claimed miles. The remaining 4% of emissions came from an estimated 43,682 miles of rail journeys in 2019/20, as a result of the low carbon nature of train travel compared to using a car.
Car journeys can be separated out further, assuming the same mix in employees’ cars for business travel as for commuting, to demonstrate that 16.9% of business travel emissions come from small cars, 47.5% from medium cars, and 9.5% from large cars.
Overtime, ADC emissions from business travel have reduced by 23% since 2015/16. All forms of business travel have reduced alongside this reduction in emissions: 53,220 fewer miles were claimed for car journeys (saving 20% of emissions), £5,450 less was spent on rail journeys (saving 2.4% of emissions) and ADC no longer have any hotel stays (saving 0.6% of emissions).
Further business travel may occur by bicycle or foot, however these have no associated carbon emissions.
Category 7: Employee Commuting
Emissions from employee commuting account for 2.8% of total Scope 3 emissions in 2019/20 and 2.6% of Ashfield District Council’s overall Scope 1-3 footprint.
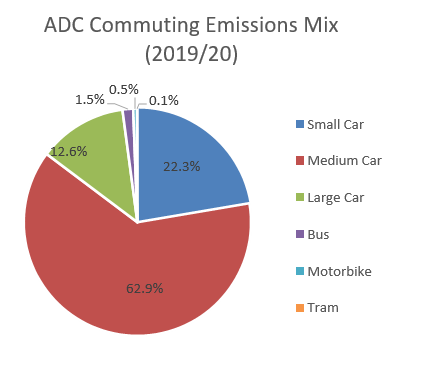
A 2020 survey demonstrated how 138 ADC employees (24.2% of all ADC employees) commuted to work. The results of this survey show that single occupancy car journeys were the most common method of transport (92.5%), followed by Tram (4.1%), Bus (2.1%, Motorbike (0.8%) and
Walking/Cycling (0.6%)25.
ADC employee commuting emissions have been calculated using the results of this survey and scaling up the survey emissions to represent the full ADC workforce. In 2019/20, ADC commuting emissions were 935.71 tCO2e.
When broken down into mode of transport, single occupancy car journeys make up the majority of ADC commuting emissions (97.9%). Large cars make up 12.6% of these emissions, medium cars 62.9% and small cars 22.3%26. The remaining commuting emissions result from Bus (1.5%), Motorbike (0.5%) and Tram (0.1%) journeys.
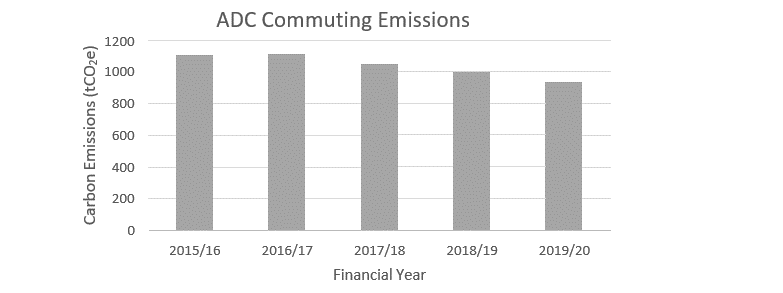
Over the last five years ADC commuting emissions have reduced by 15.4% since 2015/16. 79% of this emissions reduction is due to a decrease in the number of ADC employees and 21% reduction in the emissions intensity associated with different transport modes27, between 2015/16 and 2019/20.
It is clear that for ADC to reduce its employee commuting emissions, efforts must be made to reduce single occupancy car journeys, encouraging employees to, where possible, walk or cycle to work or use low carbon transport, such as the bus or tram.
Category 13: Downstream Leased Assets
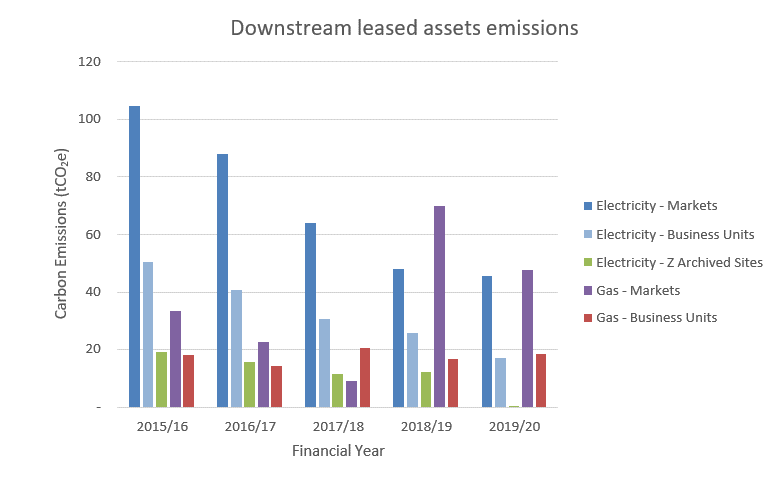
Emissions from downstream leased assets account for 0.4% of total Scope 3 emissions in 2019/20 and 0.4% of Ashfield District Council’s overall Scope 1-3 footprint. Since 2015/16, emissions from downstream leased assets have decreased by 42.7%.
Downstream leased assets consists of emissions from the operation of Ashfield District Council’s owned assets leased out to external parties. Under an operational organisational boundary, anything the council operates through a lease from an external company (category 8) will fall under scope 1 and 2. Meanwhile, assets the council owns but leases out to external parties fall under category 13 of scope 3. Where ADC have responsibility for the utility bills of Downstream Leased Assets, the costs will be either recharged to the leaseholder(s) or the cost will be covered under a service charge to the leaseholder(s).
Ashfield’s downstream leased assets which there is data for includes gas and electricity consumption. It is assumed none of these assets have refrigeration or air conditioning units.
As discussed in the utility trend analysis for Scope 1 and 2 emissions, the emissions from downstream leased assets could also be affected by grid decarbonisation (electricity), weather, renewables (solar PV), as well as changing levels of gas and electricity consumption at the sites.
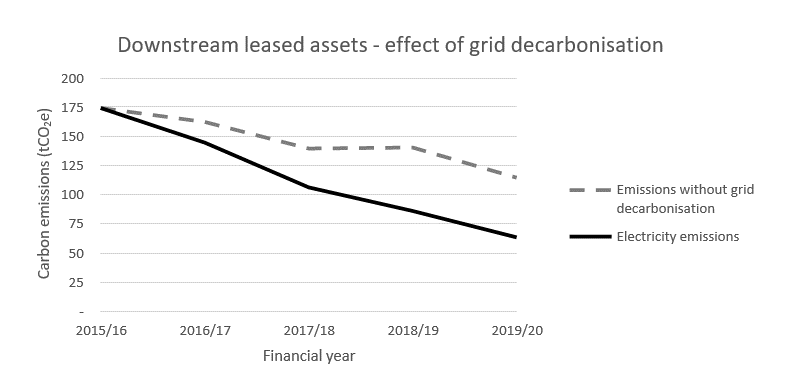
Downstream leased assets electricity emissions have decreased by 64% between 2015/16 and 2019/20, and of this, 46.1% has been due to grid decarbonisation, with the remaining 53.9% due to other changes in consumption. Additionally, 1 business unit (of four), and 1 former site (of two) have been lost during 2019/20 from the downstream leased assets category, reducing electricity consumption (no impact on gas consumption).
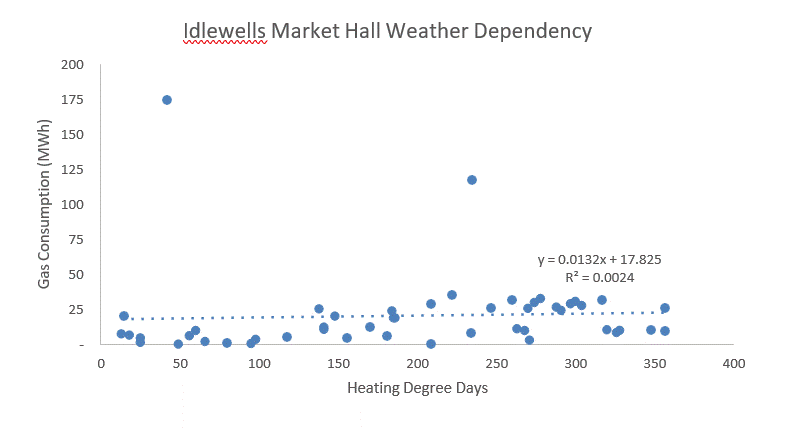
Downstream leased assets emissions from gas consumption have increased by 28% between 2015/16 and 2019/20. Gas consumption had been decreasing between 2015/16 and 2017/18, however a significant increase in Idlewells Markets Hall (Markets site group) gas consumption in 2018/19 and 2019/20 has resulted in increased emissions. This site is considered further in the Energy Consumption Analysis – Gas report, however it should be noted, this analysis considers only from April 2018 onwards, and thus whilst recognises the significant subsequent decrease from August 2019 onwards, does not note this sustained period of high usage during 2018/19 as an anomaly compared to prior years. Analysis of the weather dependency of this site over the five years suggests there is not a correlation between weather and gas consumption28, suggesting other uses of gas or poor controls (units are sub-let by ADC to small businesses) which may need further investigation.
Category 15: Investments
Emissions from investments account for 67.6% of total Scope 3 emissions in 2019/20 and 62.9% of Ashfield District Council’s overall Scope 1-3 footprint. Since 2015/16, emissions from investments have increased by 438%.
In the Greenhouse Gas Protocol, investments are split into five categories:
- Equity investment & debt investment without known use of proceeds
- Project finance & debt investments with known use of proceeds
- Project finance (where initial sponsor/lender)
- Managed investments and client services
- Other investments or financial services
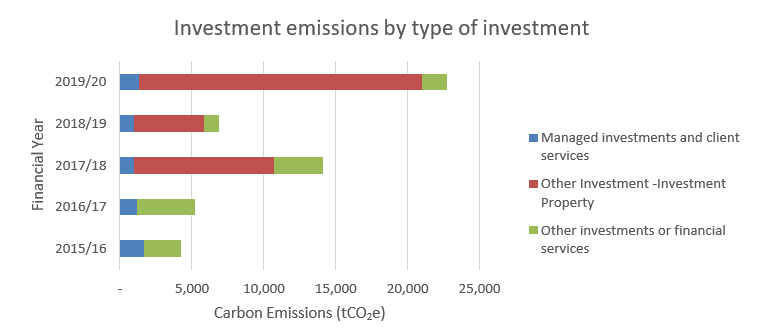
Data for the last two of these have been provided by Ashfield District Council and are included in the estimate of emissions from investments. Based on the data received, other investments or financial services has been further split into investment properties, and remaining other investments or financial services.
Emissions from managed investments and client services remains broadly consistent year on year in comparison to the other categories. These emissions have decreased by 21% from 2015/16 to 2019/20. All emissions in this category are from financial intermediation.
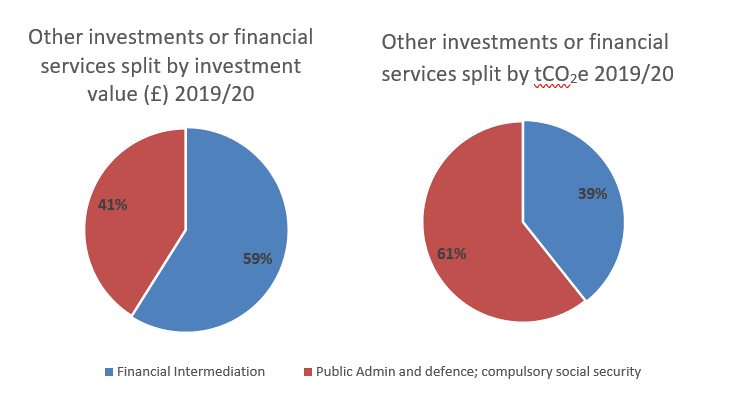
Emissions from other investments or financial services also decreased by 34% from 2015/16 to 2019/20. This reflects a 45% decrease in these investments over the same time period. In 2019/20, 59% of these investments were from investing in the financial intermediation sector, and 41% from public admin and defence, and social security. Due the comparatively lower emissions impact of financial intermediation sector however, this only accounts for 39% of the emissions from other investments or financial services.
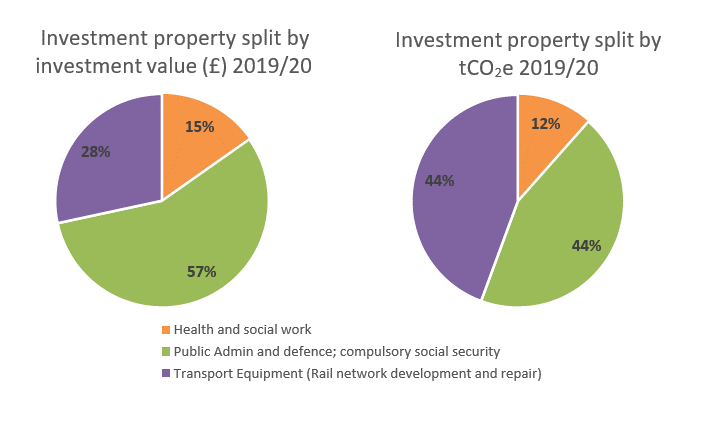
There were no emissions from investment properties in 2015/16 and 2016/17, however from 2017/18 onwards they account for over two thirds of investment emissions each year, and rising to 87% of investment emissions in 2019/20. The emissions values reflect the quantity of investment spend in these years. In 2019/20, the greatest investment by value was properties in the public admin and defence, and social security sectors (57%), then transport equipment (28%), and properties for health and social work (15%). Due to the comparatively higher emissions impact from the transport equipment sector however, there is the joint highest impact in emissions from both investments in transport equipment, and the public admin sectors (44% each). Property investments in the health and social work sector account for the remaining 12% of emissions.
19 UK Standard Industrial Classification 2007 of economic activities
20 Emissions from supply of water account for 0.2% of emissions from purchased goods and services in 2019/20, and less than 0.1% of total ADC emissions (Scopes 1-3). For further detail on water emissions, see Appendix 5.
21 Cradle-to-gate refers to the upstream life cycle of a product from resource extraction (cradle) up until it leaves the factory (to be transported to the customer/reporting organisation).
22 Scope 1 and 2 emissions for the Council include direct emissions from ADC controlled sources and indirect emissions from the generation of purchased energy
23 These calculations should be treated as indicative, where an improvement to reduce upstream transport and distribution may not be picked up in this estimation method.
24 It is assumed that water supply to allotments has no corresponding waste water
25 ADC employee commuting mix is presented as a percentage of the total number of commuting days per week, taking into account the mode of transport and the number of days ADC employees commute per
26 Size of car engine determines the split between small, medium and large cars, as outlined in BEIS conversion factor methodology.
27 2020 commuting mix remains unchanged throughout the five year period.
28 This is also the case if ignore the two anonymously high readings for June 2018 and February 2019.