3. Scope 1 and 2 Emissions
Fleet Emissions
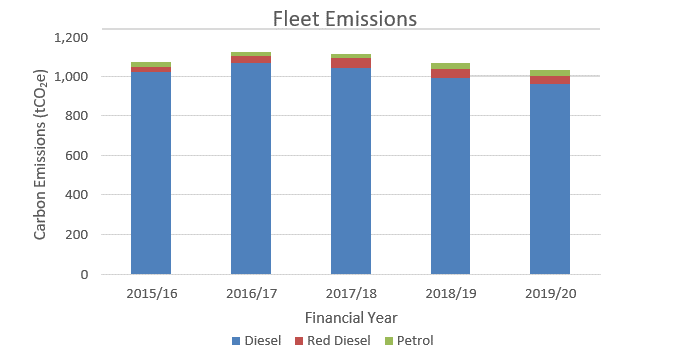
In 2019/20, emissions from fleet accounted for 40.8% of ADC’s Scope 1 and 2 emissions (1033 tCO2e). Fleet emissions have reduced by 3.8% compared to 2015/16, despite a 2.4% increase in the total number of fuel claims. The 2019/20 fleet emissions mix is dominated by 93.3% diesel, 3.9% red diesel and 2.9% petrol, similar to the last 5 year period.
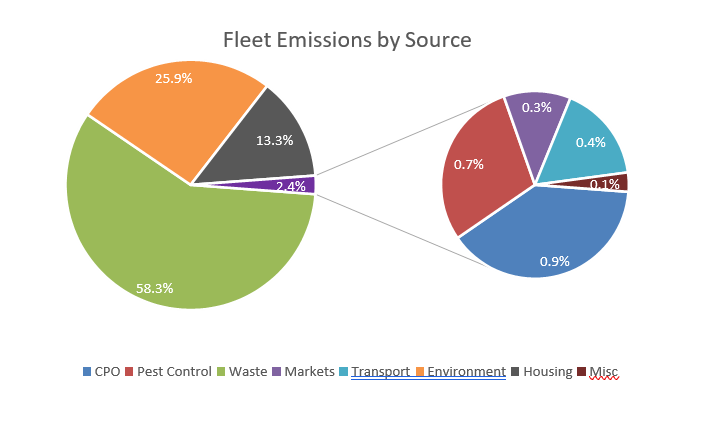
Fleet emissions can be split further based on each ADC service that use fleet vehicles. The Waste service dominate the fleet emissions sources (58.3%), alongside Environment (25.9%) and Housing (13.3%), with other sectors making up the remaining 2.4% of emissions.
Gas Emissions
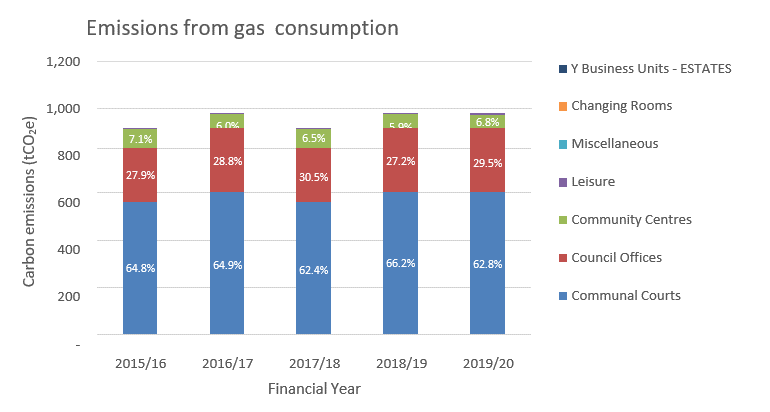
In 2019/20, emissions from gas consumption accounted for 38.7% of ADC’s Scope 1 and 2 emissions.
There was no gas consumption data for the Ashfield Homes sites for 2015/16 and up to October 2016. This data has therefore been estimated from a calculated monthly average for these sites for data up to March 2020. Similarly, for other sites with missing historic utility data, a monthly average per site has been backfilled.
In 2019/20, the Housing ‘Sheltered accommodation’ Courts accounted for 62.8% of emissions from gas consumption, Council Offices 29.5% and Community Centres 6.8%. As with electricity consumption, these relative proportions have remained similar for the past 5 years. Gas emissions have however increased by 11.8% from 2015/16 to 2019/20. The reasons for this are explored further in the following trend analysis (Section 4).
Individual high gas consumption buildings have been further analysed in the Energy Consumption Analysis report completed November 2020 by NCC Energy Services. This found 15 sites accounted for approximately 90% of the estate’s total gas consumption. As would be expected, this includes the larger Offices, the Northern depot, and the Housing ‘Sheltered accommodation’ courts.
Electricity Emissions
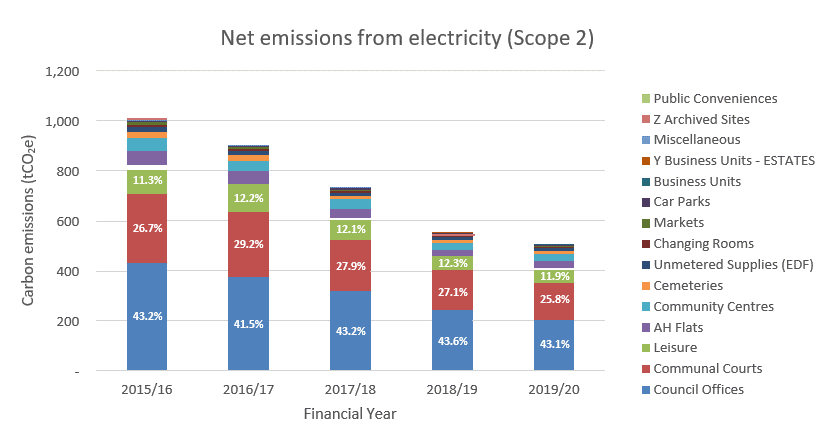
In 2019/20, emissions from electricity emissions accounted for 20.0% of ADC’s Scope 1 and 2 emissions. As with gas consumption, there was no electricity consumption data for the Ashfield Homes sites for 2015/16 and up to October 2016. This data has therefore been estimated from a calculated monthly average for these sites for data up to March 2020. Similarly, for other sites with missing historic electricity data, a monthly average per site has been backfilled.
In 2019/20, Council Offices accounted for 43.1% of net electricity emissions, Communal Courts 25.8%, Leisure11 11.9%. These proportions of emissions have been similar for the past 5 years, however between 2015/16 and 2019/20, net electricity emissions12 have decreased by 49.9%. The reasons for this are explored further in the following trend analysis.
Individual high electricity consumption buildings have been further analysed in the Energy Consumption Analysis report completed November 2020 by NCC Energy Services. This found 16 sites accounted for approximately 75% of the estate’s total electricity consumption.
Biomass Emissions
In 2019/20, emissions from biomass accounted for 0.3% of ADC’s Scope 1 and 2 emissions. ADC have two biomass boilers at Titchfield Court and Sherwood Court, which use wood pellets with gas back- up. The emissions from the gas back-up are captured within the gas emissions. In 2019/20, 83% of the biomass emissions are from the Sherwood Court biomass boiler, consistent with the greater mass of wood pellets burnt.
Fugitive Emissions
In 2019/20, fugitive emissions accounted for 0.2% of ADC’s Scope 1 and 2 emissions. Fugitive emissions are from fleet air conditioning units, air conditioning units (in buildings), and fridges. Fleet air conditioning units account for 97% of fugitive emissions. As there is no change in the number of air conditioning units since 2015/16 to 2019/20, this is the case for each year in the reporting period.
11 Leisure site group excludes leisure centres, as utility consumption is paid for by the leisure centre operator.
12 Emissions for Ashfield District Council’s operational estate from electricity consumption, excluding electricity consumption from solar PV generated onsite.